Axes
- 2 minutes to read
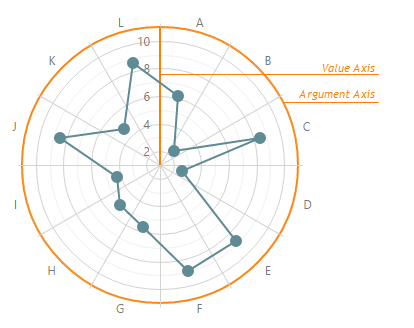
A coordinate system is used to determine each point uniquely on a plane through two numbers, the argument and the value of a point. To define the coordinates, two lines - the axes - are specified: the axis of arguments and the axis of values. In the polar coordinates, the argument axis is the circle — different arguments have different angles (by default, the start angle is at the top, positive direction is clockwise). The value axis is vertical with the start point at the center of the circle by default. A point’s value in polar coordinates is defined as a distance of the point from the center of the circle.
Axis options can be set using the chart’s BootstrapPolarChart.ValueAxis and BootstrapPolarChart.ArgumentAxis properties. Use the BootstrapChart.SettingsCommonAxis property if you need to set the same values for all axes.
There are three types of argument and value axes:
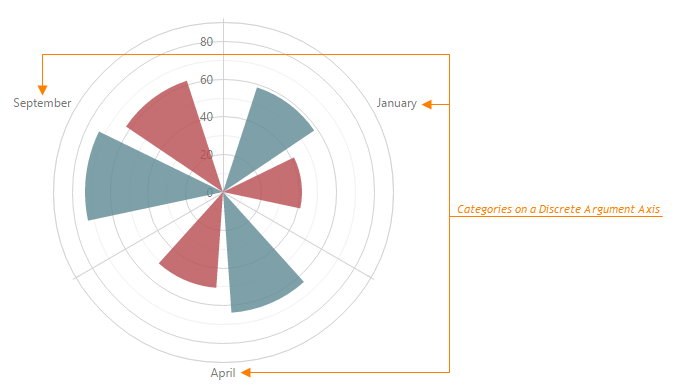
Discrete - Contains a finite number of values, each of which represents an argument or value of a particular series point, and is created if arguments or values in the series’ data source are strings. These values are called categories and arranged in a certain order.
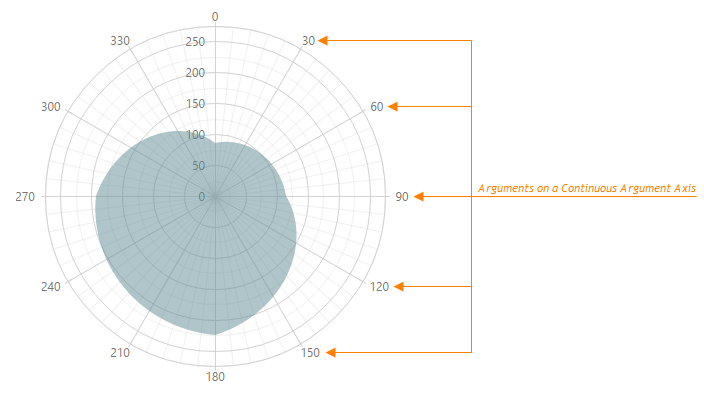
Continuous - Contains an infinite number of values, some of which represent series point arguments or values, and is created if arguments or values in the series’ data source are numeric or date-time values.
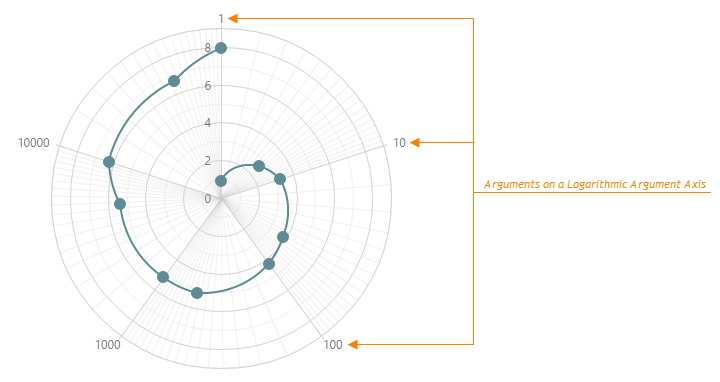
Logarithmic - Contains an infinite number of values, each of which represents a number (logarithm base) raised to a power on the logarithmic axis and can be used with numeric data source values only. The BootstrapChartCommonAxisSettings.LogarithmBase option specifies these numbers. This axis is useful when you visualize a huge range of data.