Series Types
- 8 minutes to read
The Bootstrap Chart control supports the following series types.
Area Series
Note
Online Demo To see chart series of the Area family in action, view the following demo online: Area Series
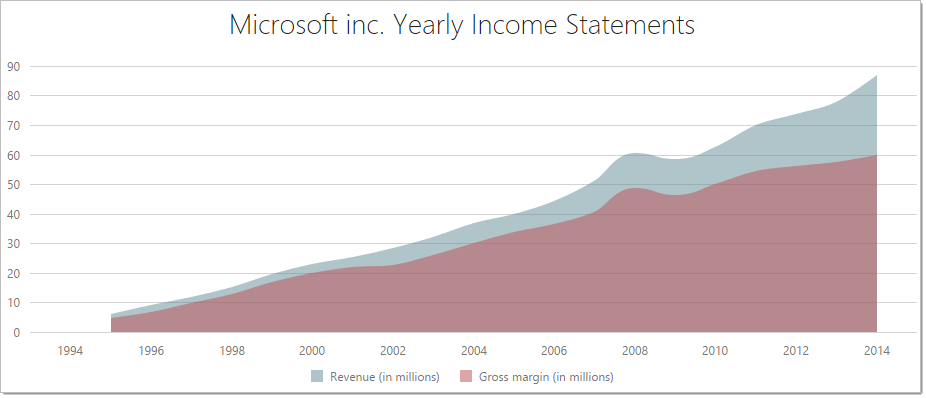
Area
The Area series type is useful when you need to emphasize a change in values. With this series type, data is displayed by a straight line that joins points, and the shaded area between this line and the argument axis. This line is a border and is invisible by default.
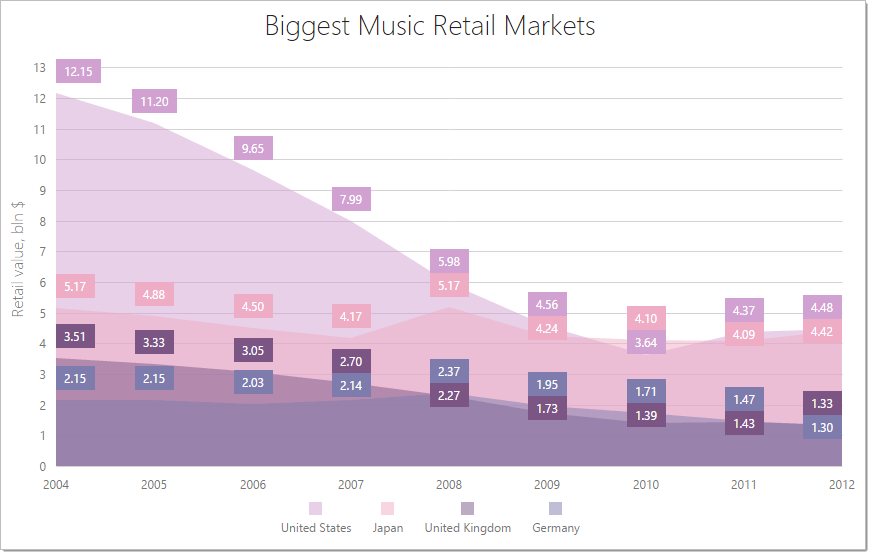
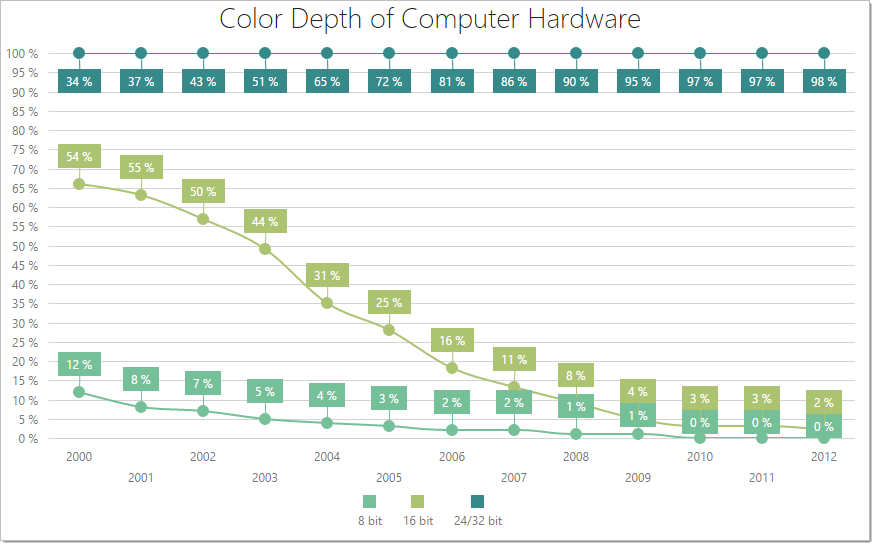
Full Stacked Area
The FullStackedArea series type is used when it is necessary to compare the value percentage of several area series for each argument. In this series type, the areas do not overlap because they are cumulative at each point. The value axis is always continuous and it displays a range from 0 to 100 percent.
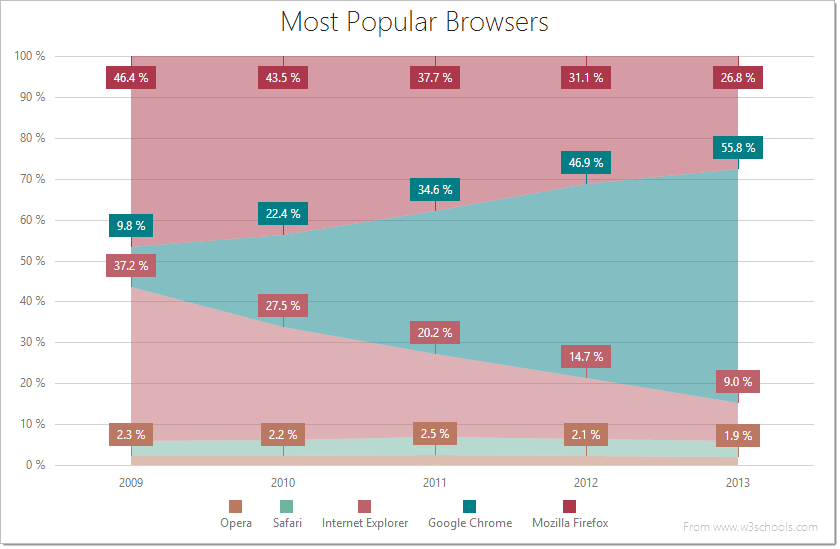
Full Stacked Spline Area
The FullStackedSplineArea series type is used when it is necessary to compare the value percentage of several splineArea series for each argument. In this series type, series data is displayed as points joined using a spline interpolation, and the shaded area between the spline and the argument axis. The joining line is the series’ border, and it is not visible by default.
Spline Area
The SplineArea series type is useful when you need to emphasize a change in values, but smooth the line that connects the points. With this series type, data is displayed as points joined using a spline interpolation, and the shaded area between the spline and the argument axis. The joining line is the series’ border, and it is not visible by default.
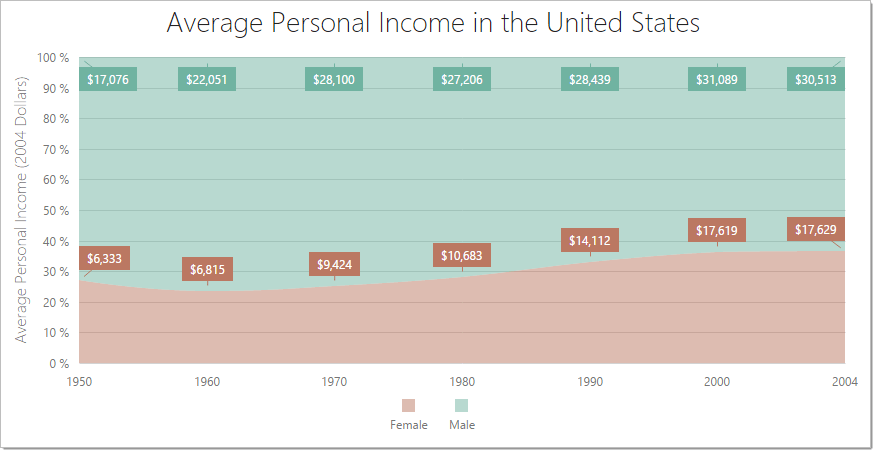
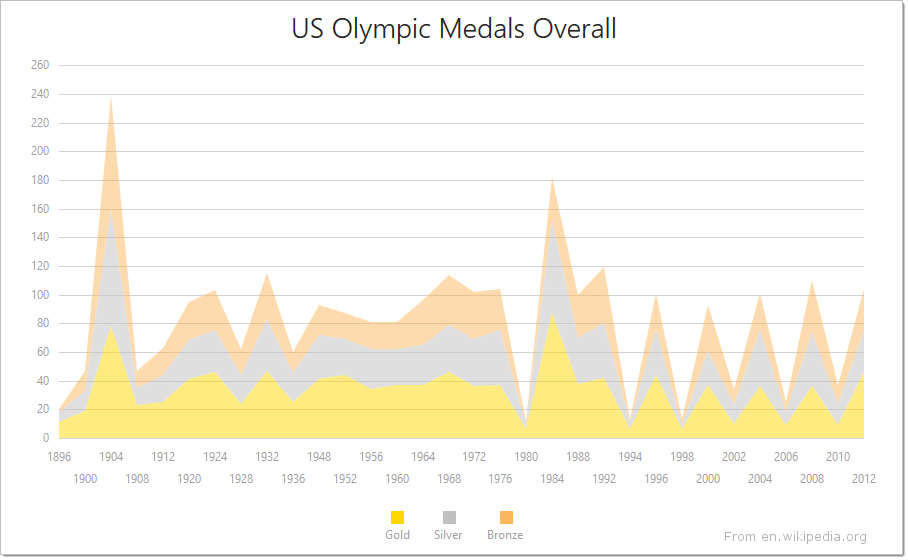
Stacked Area
The StackedArea series type is used when you have several area series and it’s necessary to compare how much each series adds to the total aggregate value for specific arguments. With this series type, the areas do not overlap because they are cumulative at each point.
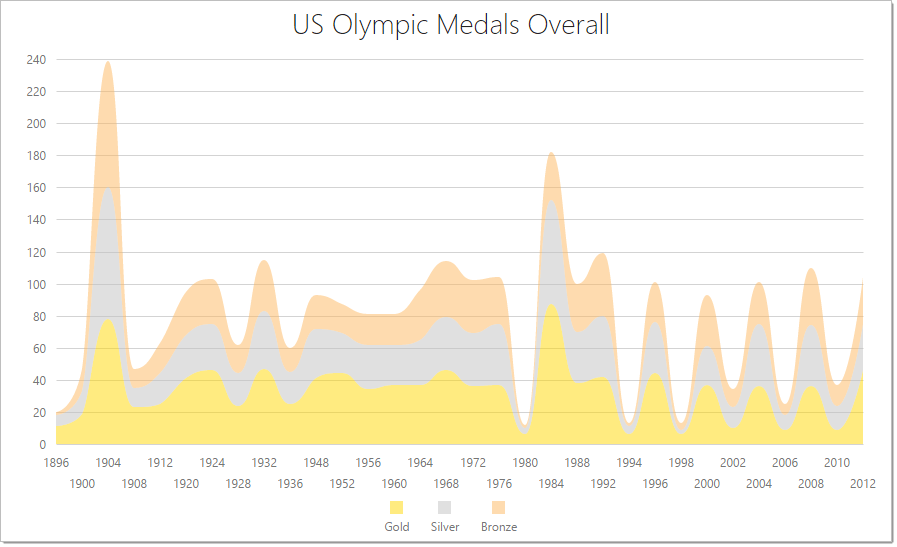
Stacked Spline Area
The StackedSplineArea series type is used when you have several splineArea series and it’s necessary to compare how much each series adds to the total aggregate value for specific arguments. The areas do not overlap because they are cumulative at each point. With this series type, data is displayed as points joined using a spline interpolation, and the shaded area between the spline and the argument axis. The joining line is the series’ border, and it is not visible by default.
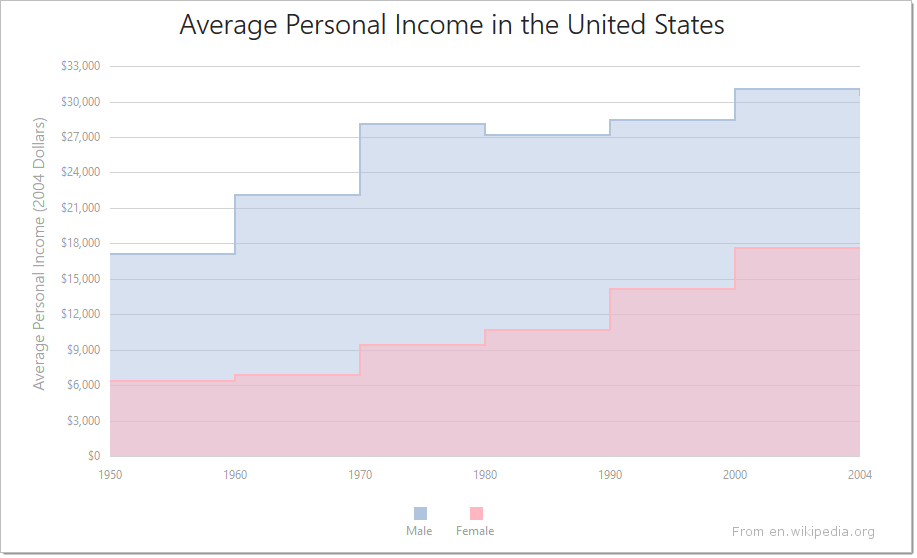
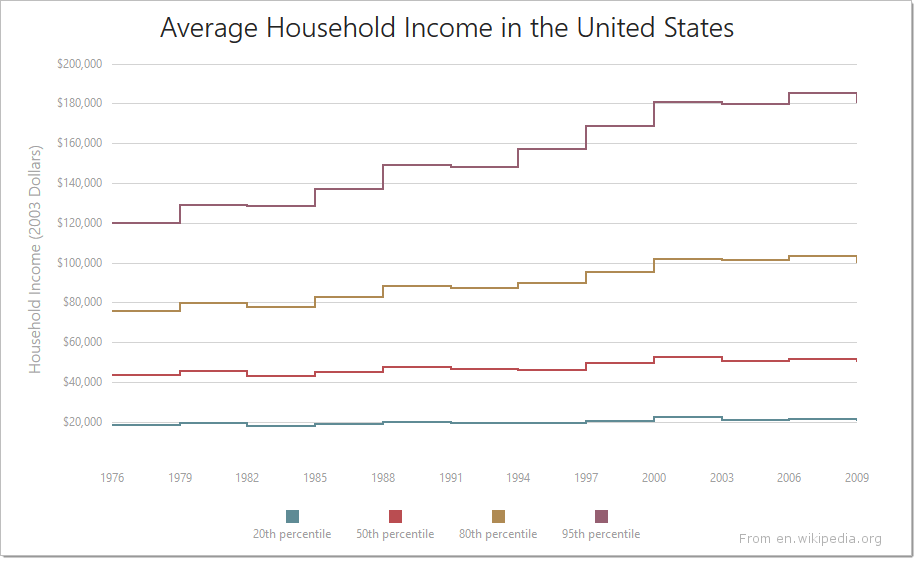
Step Area
The StepArea series type has all the features and characteristics of the Area series type, but the shortest line that joins points in the Area series is replaced by the vertical and horizontal lines in the StepArea series. These lines form so-called “steps”.
Bar Series
Note
Online Demo To see chart series of the Bar family in action, view the following demo online: Bar Series
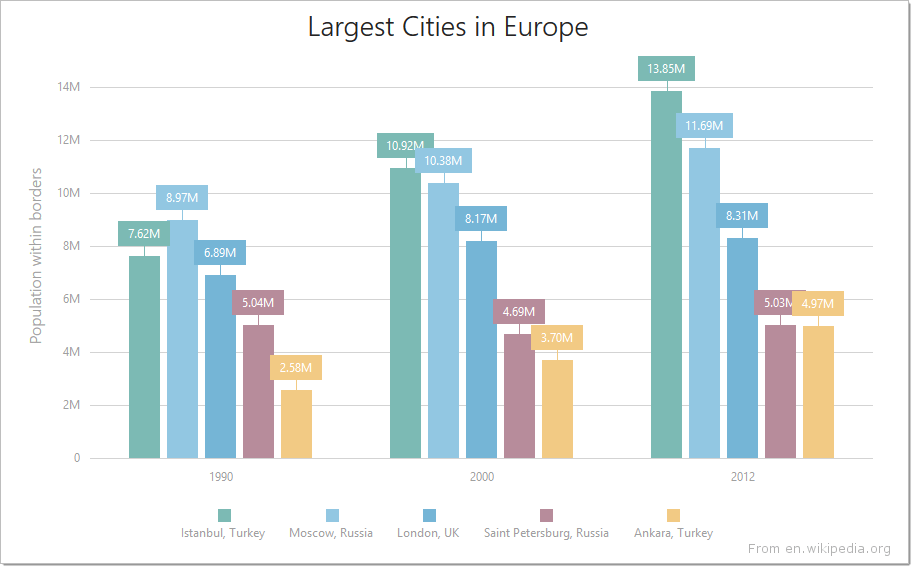
Bar
In the Bar series type, data is displayed as sets of rectangular bars with lengths proportional to the values that they represent. Often, bar series are used to compare values in different discrete categories such as months, countries, age, etc. When there are several bar series, bars for each argument are displayed side-by-side. If you need to show bars for each series stacked on each other, use the StackedBar series type.
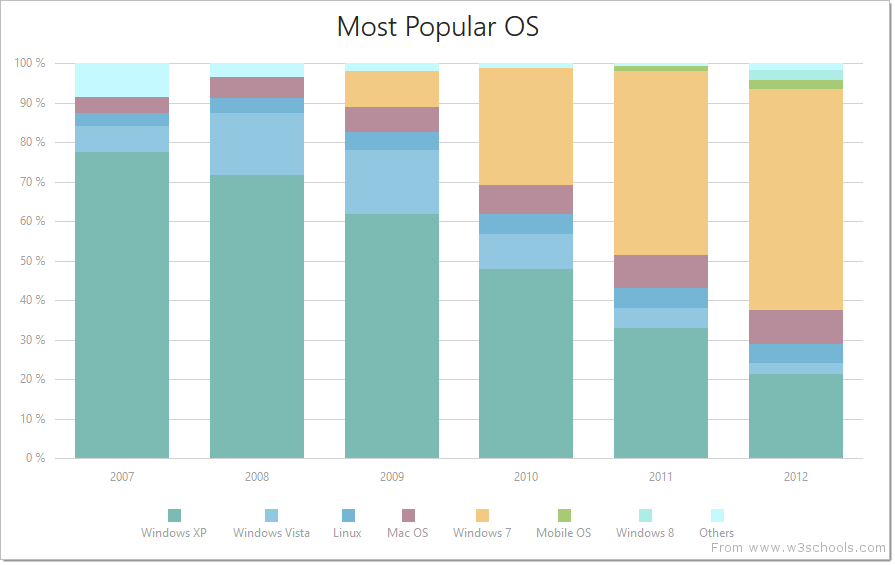
Full Stacked Bar
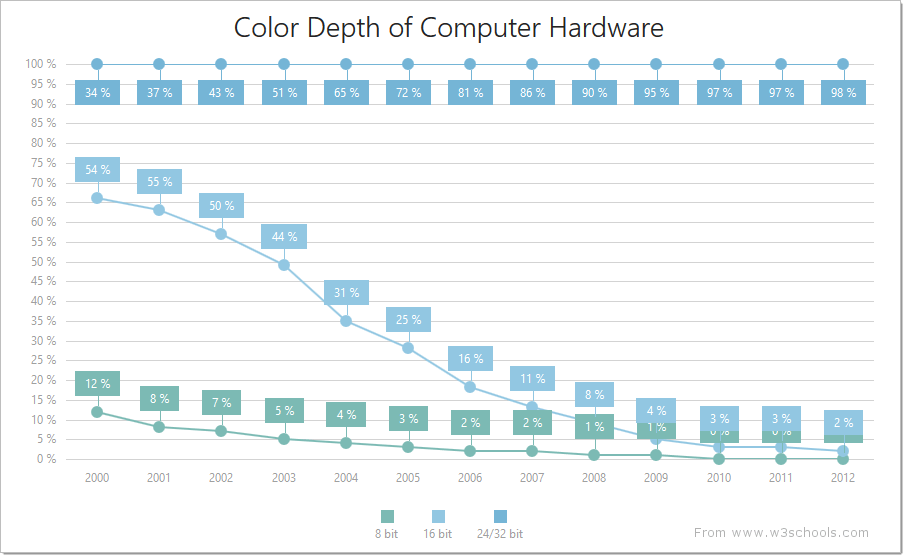
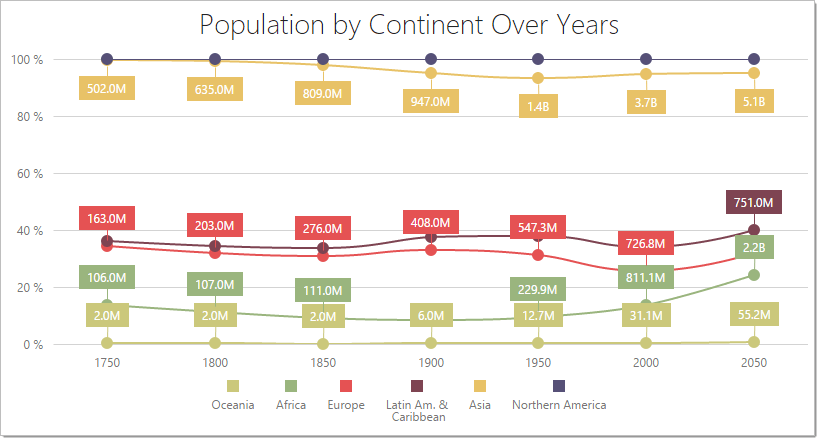
The FullStackedBar series type is used when it’s necessary to compare the value percentage of several bar series for each argument. With this series type, data is displayed as rectangular bars with lengths proportional to their value percentage. Bars of each subsequent series are stacked on top of the bars of the previous series. The height of the resulting bar is always equal to 100 percent. The value axis is always continuous and displays the range from 0 to 100 percent.
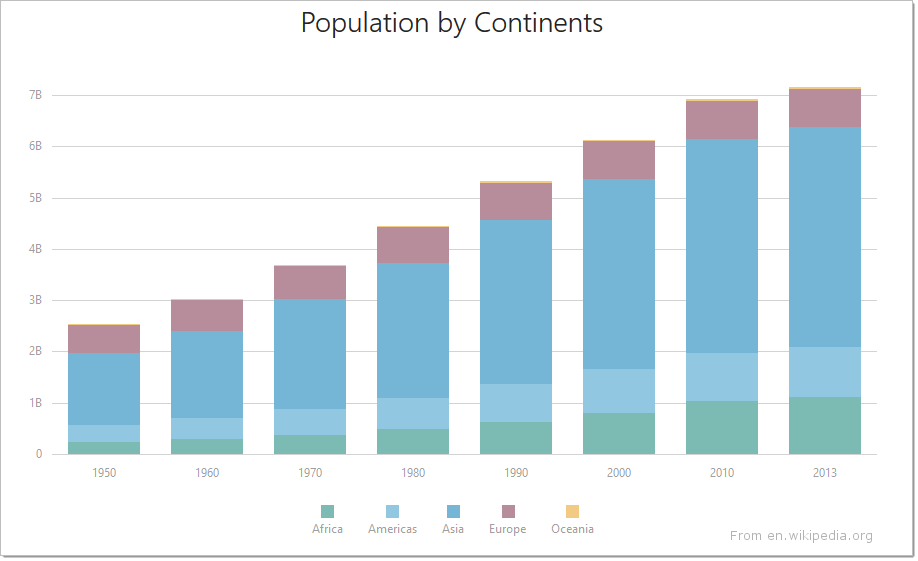
Stacked Bar
The StackedBar series type is used when there are several series that represent values for discrete categories. With this series type, data is displayed as rectangular bars with lengths proportional to the values that they represent. Bars of each subsequent series are stacked on top of the bars of the previous series. The height of the resulting bar shows the combined result of a category.
Financial Series
Note
Online Demo To see chart series of the Financial family in action, view the following demo online: Financial Series
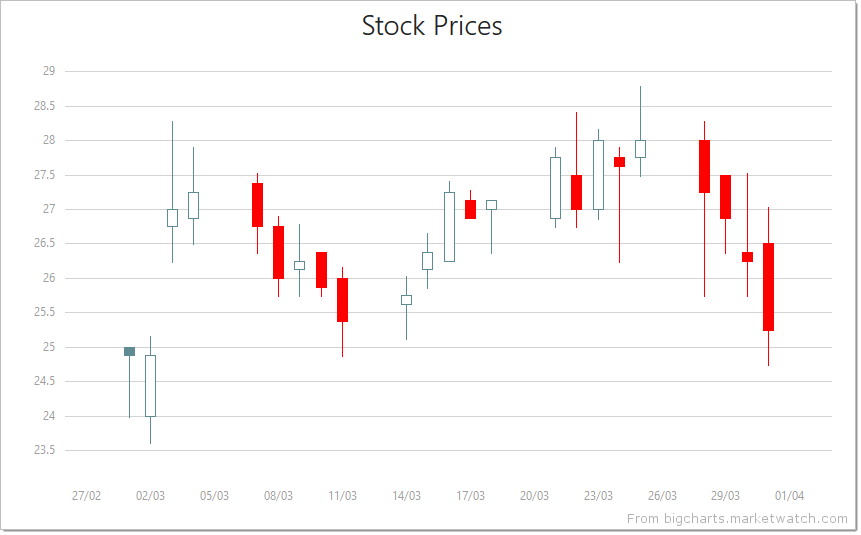
Candlestick
The CandleStick series type is used to show the variation in the price of stock over the course of a day. Each point consists of a rectangle (body), whose bottom and top values correspond to the open and close prices, and a vertical line (shadow, wick or tail), whose bottom and top values correspond to the low and high prices. If the stock closes higher than its opening price, the body is hollow. And if the stock closes lower than its opening price, the body is filled.
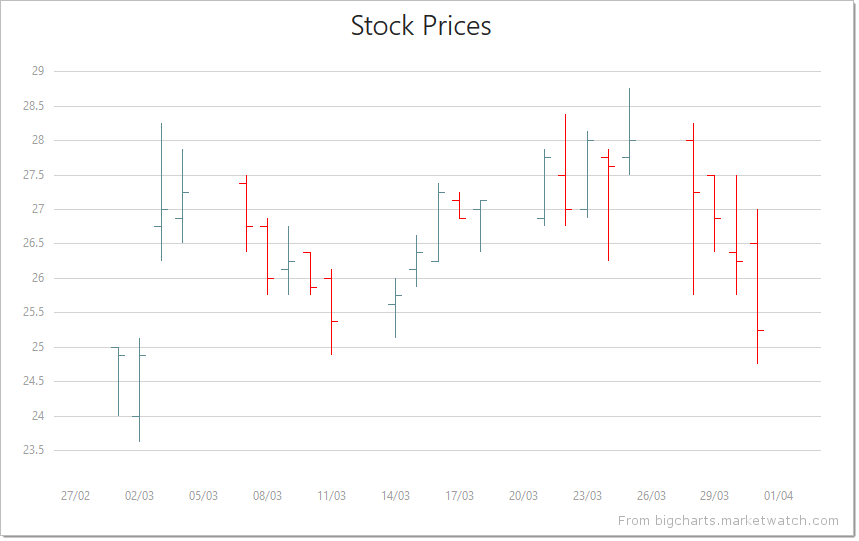
Stock
The Stock series type is used to show a variation in stock prices over the course of a day. The low and high prices are represented by the bottom and top values of a vertical line, which is shown at each point, and the open and close prices are represented by the left and right tick marks, respectively.
Line And Point Series
Note
Online Demo To see chart series of the Line And Point family in action, view the following demo online: Line And Point Series
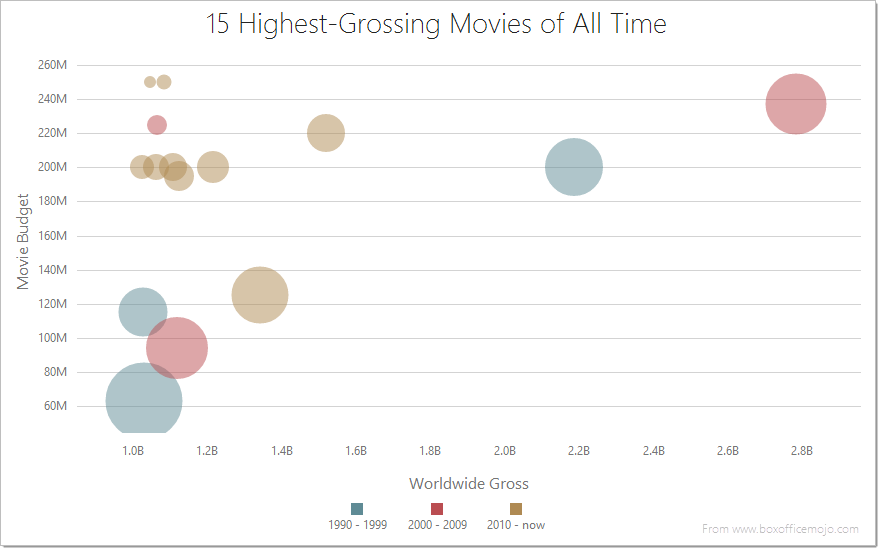
Bubble
When you use the Bubble series type, the series points are displayed as bubbles of different sizes. This series type is especially useful when you visualize a data set with four dimensions: the first two dimensions are indicated by coordinates on the axes, the third - by a color, and the fourth - by the size of the bubble.
Full Stacked Line
The FullStackedLine series type is used when it is necessary to compare the value percentage of several line series for each argument. In this series type, series data is displayed as points joined by a straight line. The lines do not overlap because they are cumulative at each point. The value axis is always continuous, and it displays the range from 0 to 100 percent.
Full Stacked Spline
The FullStackedSpline series type is used when it is necessary to compare the value percentage of several spline series for each argument. In this series type, series data is displayed as points joined using a spline interpolation. The lines do not overlap because they are cumulative at each point. The value axis is always continuous, and it displays the range from 0 to 100 percent.
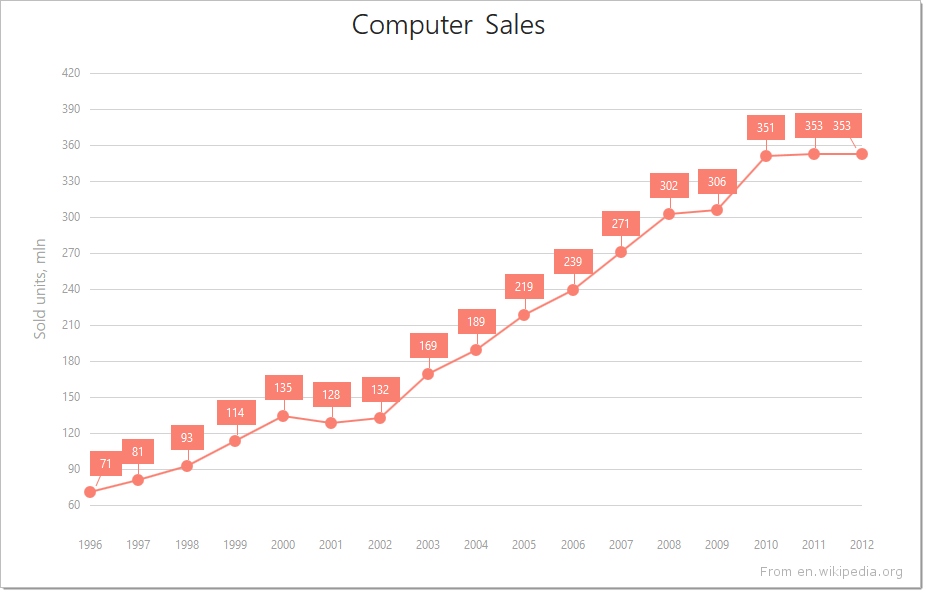
Line
With the Line series type, data is displayed as points joined by a straight line. This series type, which is useful when you need to visualize a trend in data over intervals, is used in the Chart control by default. However, there may be scenarios when you need to set this series type explicitly. To do this, assign ‘line’ to the type property of the series configuration object.
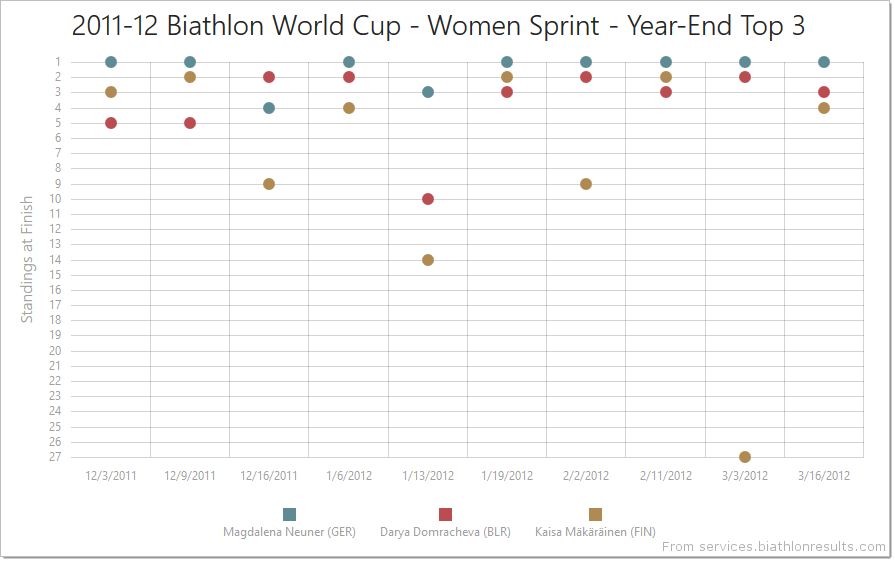
Scatter
With the Scatter series type, data is displayed as a collection of points. This series type is often used when a variable exists under the control of the tester.
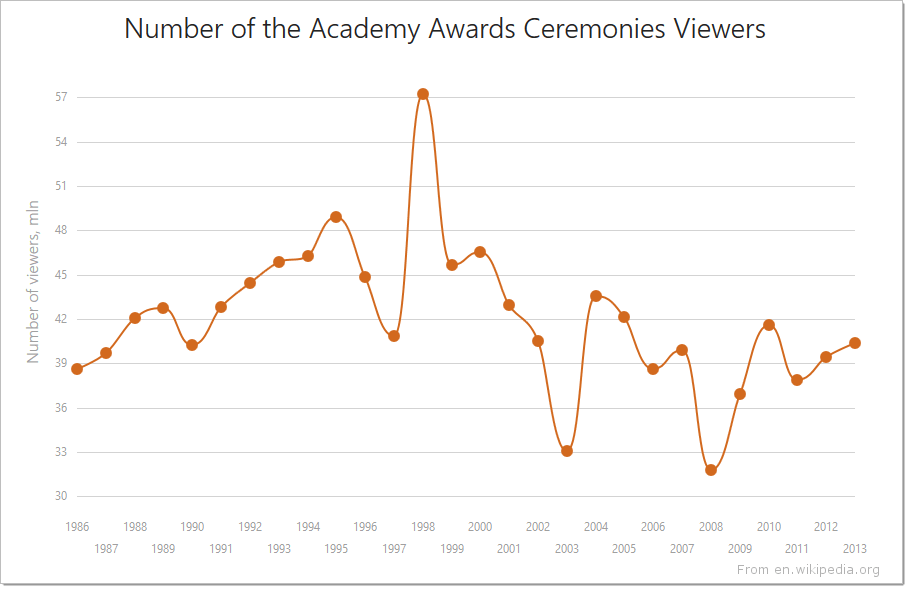
Spline
With the Spline series type, data is displayed as points joined using a spline interpolation. This series type is useful when you need to visualize a trend in data over intervals, and prefer smoothing the line that connects the points.
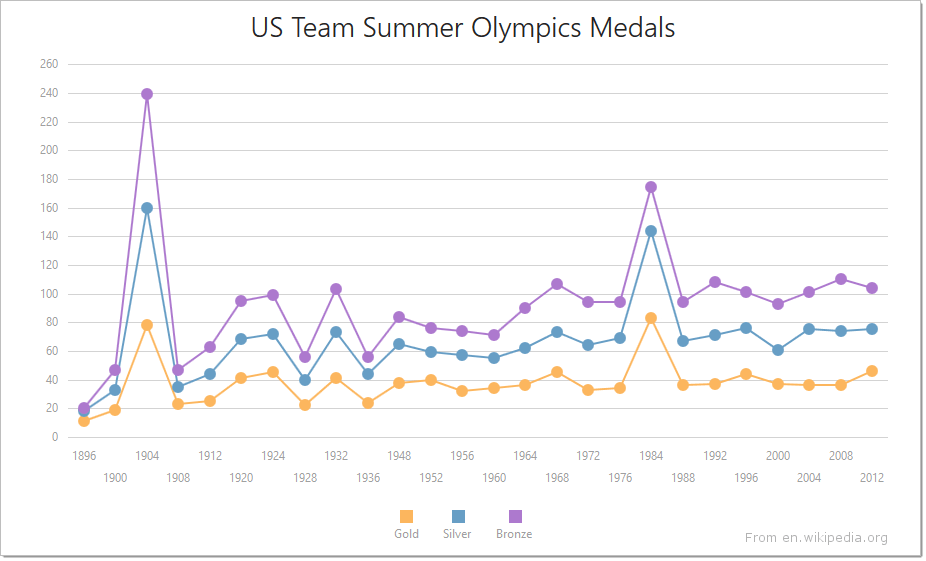
Stacked Line
The StackedLine series type is used when you have several series and it’s necessary to compare how much each series adds to the total aggregate value for specific arguments. With this series type, series data is displayed as points joined with a straight line. The lines do not overlap, because they are cumulative at each point.
Stacked Spline
The StackedSpline series type is used when you have several series and it’s necessary to compare how much each series adds to the total aggregate value for specific arguments. With this series type, series data is displayed as points joined using a spline interpolation. The lines do not overlap, because they are cumulative at each point.
Step Line
The StepLine series type has all the features and characteristics of the line series type, but the shortest line that joins points in the “line” series is replaced by the vertical and horizontal lines in the “stepLine” series. These lines form so-called “steps”.
Range Series
Note
Online Demo To see chart series of the Range family in action, view the following demo online: Online Demo: Range Series
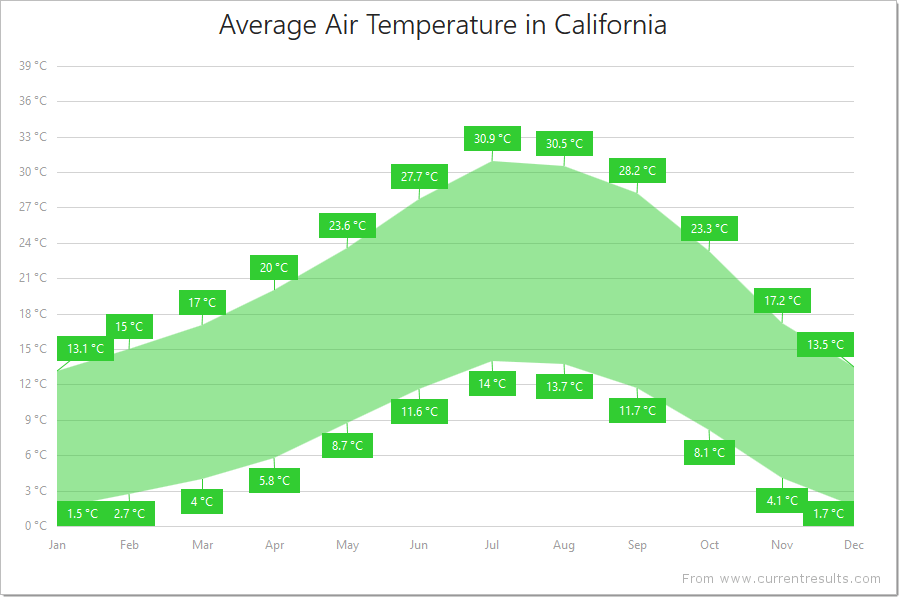
Range Area
The RangeArea series type is used to display value ranges corresponding to the specified arguments. In this series type, data is displayed as the shaded area between the line that joins the series’ start points and the line that joins the series’ end points. The line that joins data points is the series’ border, which is not visible by default.
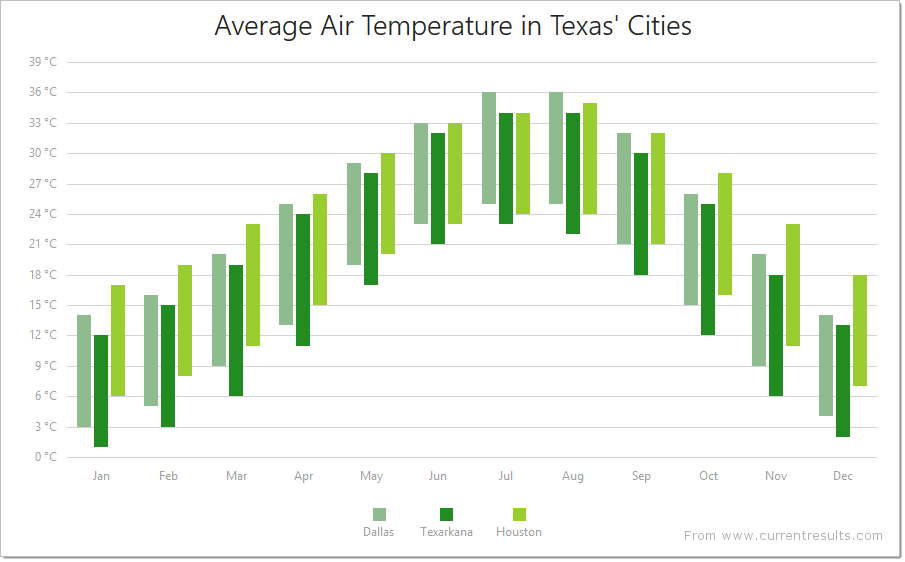
Range Bar
The RangeBar series type is used to display value ranges corresponding to the specified arguments. With this series type, data is displayed as sets of rectangular bars beginning at the specified start value and ending at the specified end value. When there are several rangeBar series, bars for each argument are displayed side-by-side.