Fields
- 2 minutes to read
Pivot Grid Fields supply data toASPxPivotGrid. Fields are visualized with field headers which you can drag-and-drop between the Pivot Grid areas. Dragging fields between areas modifies the report layout.
To create a report in ASPxPivotGrid, create pivot grid fields and position them within the Pivot Grid areas.
- create a PivotGridField object and add it to the ASPxPivotGrid.Fields collection;
- specify the field’s area (the PivotGridFieldBase.Area property) and position within this area (the PivotGridFieldBase.AreaIndex property). The PivotGridFieldBase.AreaIndex property can be set only after the field is added to the control’s field collection;
- set the PivotGridField.ID property to a unique value. The field’s unique identifier is used when you save/restore the pivot grid’s layout, group fields and use templates.
You can place a field in one of four areas: Column, Row, Data, and Filter Header Area. The field’s function is determined by the area in which it is displayed:
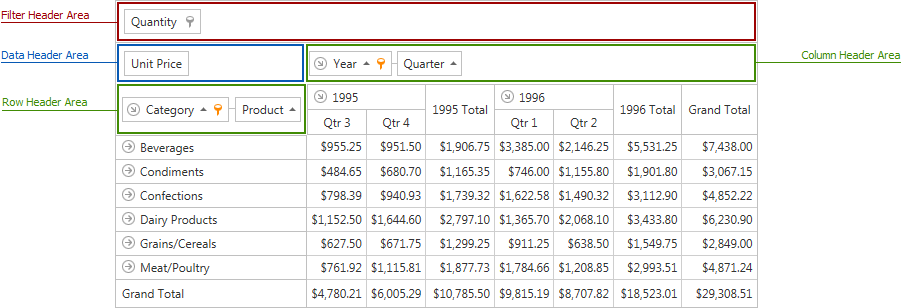
- position a field within the Column Header Area to list its values along the control’s top edge. These field’s values are column headers;
- position a field within Row Header Area to list its values along the control’s left edge. These field’s values are row headers;
- position a field within Data Header Area to calculate summaries against this fields. The summaries are calculated for all the cells; a specific column and row identifies each cell;
- position a field within the Filter Header Area to make this field available for further customizations. For instance, you can drag it to a different area later. In addition, a user can use the filter drop-down to filter data against a filter field.
Binding Basics
ASPxPivotGrid supports bound and unbound fields. A bound field retrieves data from a field in a pivot grid’s data source. An unbound field is not associated with a data source and should be populated with data. Refer to the following help topic for more information about unbound fields: Unbound Fields.
To bind a pivot grid field to a data source field, use the PivotGridField.FieldName property. This property gets or sets the name of the data field bound to a pivot grid field. Set the PivotGridFieldBase.UnboundType property to UnboundColumnType.Bound.
Refer to Binding to Data Overview and Binding to OLAP Data Sources for details.