How to: Add a Chart to an ASPxCallbackPanel during its Callback (Runtime Sample)
- 2 minutes to read
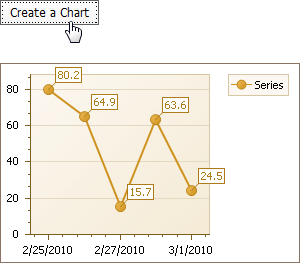
This tutorial demonstrates how a WebChartControl can be added to an ASPxCallbackPanel during its callback.
Tip
A complete sample project is available in the DevExpress Code Examples database at http://www.devexpress.com/example=E568.
- Create a new ASP.NET Web Application (Visual Studio 2008 or 2010), or open an existing one.
Add the required assemblies to the project.
Note that if you prefer that the assemblies be added automatically (by dropping a WebChartControl instance onto the page), this affects your web application’s Web.config file. To learn about the changes being made to it, refer to Adding a Web Chart.
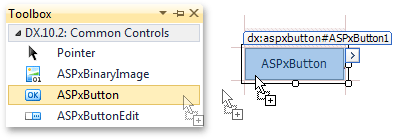
Switch to the Design view of the Default.aspx page, and from the DX.18.2: Common Controls toolbox tab, drop an ASPxButton onto the page.
Then, click the button’s smart tag. In the invoked actions list, disable the AutoPostBack property, and click Client-Side Events… link.
In the invoked dialog, from within the client-side Click event handler, call the PerformCallback() for the callback panel.
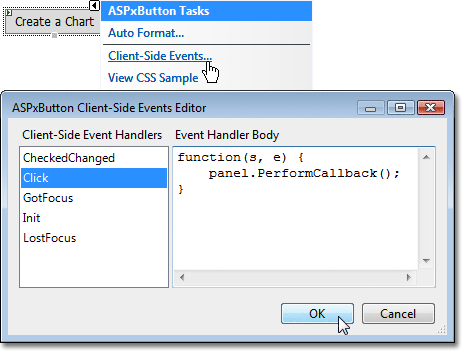
To apply the changes, and quit the dialog, click OK.
Now, from the DX.18.2: Navigation & Layout toolbox tab, drop an ASPxCallbackPanel onto the page.
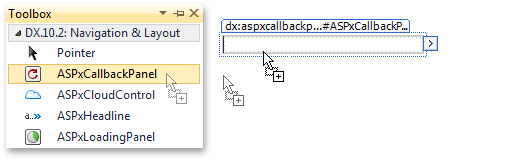
Set its ClientInstanceName to panel, and handle its Callback event in the following way.
using System;
using DevExpress.XtraCharts;
using DevExpress.XtraCharts.Web;
using DevExpress.Web.ASPxClasses;
using DevExpress.Web.ASPxCallbackPanel;
// ...

protected void ASPxCallbackPanel1_Callback(object sender,
CallbackEventArgsBase e) {
    WebChartControl wbc = new WebChartControl();

    wbc.Series.Add(new Series("Series", ViewType.Line));
    wbc.Series[0].ArgumentScaleType = ScaleType.DateTime;
    wbc.Series[0].ValueScaleType = ScaleType.Numerical;

    Random r = new Random();
    for (int i = 0; i < 5; i++) {
    wbc.Series[0].Points.Add(new SeriesPoint(DateTime.Today.AddDays(i),
        ((int)((r.NextDouble() * 100) * 10)) / 10.0));
    }

    wbc.Width = ((ASPxCallbackPanel)sender).Width;
    ((ASPxCallbackPanel)sender).Controls.Add(wbc);
}
Run the application, and view the result.