Data Cell Layout
- 2 minutes to read
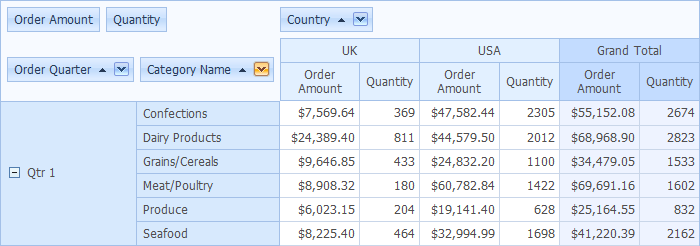
The Pivot Grid allows you to create reports with an unlimited number of data fields. When there are two or more data fields, their headers are displayed to distinguish between different summary values. Data cells are located one after another as shown in the image below.
The location and orientation of data field headers is controlled by the Data header. This is a header which is linked with the data field headers. Like any other header, end-users can drag it to different locations to fine-tune a report. The content, size and availability of the Data header are controlled via the options provided by the pivot grid’s ASPxPivotGrid.OptionsDataField property. These options are listed and described in the table below.
Property | Description |
|---|---|
Specifies the area in which the data field headers are displayed when there are two or more data fields. Setting this property to PivotDataArea.ColumnArea or PivotDataArea.RowArea enables the Data header. Its position among field headers can be changed using drag-and-drop. | |
Specifies the position of the data field headers within the hierarchy of field values. | |
Specifies the text displayed within the Data header. | |
Specifies the width of the data field headers when they are displayed as row headers. |
The animation below shows how to change the location of the Data header via drag-and-drop: