How to: Add a Chart to a Web Page (Runtime Sample)
- 3 minutes to read
This tutorial demonstrates how a chart can be generated and shown in a web page with a button click. For an alternative approach to this task, refer to How to: Add a Chart to an ASPxCallbackPanel during its Callback (Runtime Sample).
To demonstrate how this can be done, do the following.
- Create a new ASP.NET Web Application (Visual Studio 2012, 2013, 2015, 2017 or 2019), or open an existing one.
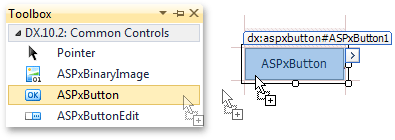
Switch to the Design view of the Default.aspx page, and drag an ASPxButton from the DX.20.2: Common Controls toolbox tab onto the page. Handle its Click event to generate a web chart.
Add the required assemblies to the project.
Note that if you prefer to add assemblies automatically (when you drop a WebChartControl instance onto the page), this affects your web application’s Web.config file. Refer to the following help topic for details on the changes made to this file: Adding a Web Chart.
Double-click ASPxButton1 to handle its Click event. Add the following code to the event handler.
Note that prior to accessing elements and properties of a dynamically created WebChartControl, it should be added to the Page.Form.Controls collection.
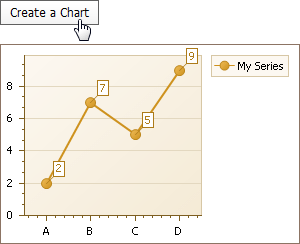
using System;
using DevExpress.XtraCharts;
using DevExpress.XtraCharts.Web;
// ...

protected void ASPxButton1_Click(object sender, EventArgs e) {
    // Create a WebChartControl instance.
    WebChartControl WebChartControl1 = new WebChartControl();

    // Add the chart to the form.
    // Note that a chart isn't initialized until it's added to the form's collection of controls.
    this.form1.Controls.Add(WebChartControl1);

    // Create a line series and add points to it.
    Series series1 = new Series("My Series", ViewType.Line);
    series1.Points.Add(new SeriesPoint("A", new double[] { 2 }));
    series1.Points.Add(new SeriesPoint("B", new double[] { 7 }));
    series1.Points.Add(new SeriesPoint("C", new double[] { 5 }));
    series1.Points.Add(new SeriesPoint("D", new double[] { 9 }));

    // Add the series to the chart.
    WebChartControl1.Series.Add(series1);
}
Run the web application, and click ASPxButton1 to see the chart.
Tip
For the complete sample project, see the following DevExpress Support Center example: https://supportcenter.devexpress.com/ticket/details/e1171/how-to-dynamically-add-a-webchartcontrol-to-a-web-page.