How to: Add a Chart to a Web Application
This tutorial demonstrates how to add the WebChartControl to a Web Page at design time.
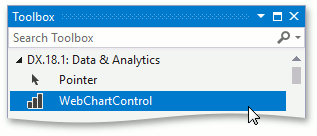
By default, the WebChartControl item is added to the DX.18.2: Data & Analytics toolbox tab, drop the WebChartControl toolbox tab of the Visual Studio IDE. So, to add the Web Chart Control to your project, simply drag the corresponding toolbox item, and drop it onto the form.
After that, you can add series (of either 2D series views or 3D series views) to your chart, and populate them with data.
Note
After a WebChartControl is dropped onto a page, your web application’s Web.config file is affected. To learn more on these changes, refer to Adding a Web Chart.
For specific information on working with XtraCharts in an ASP.NET platform, refer to Concepts.
See Also