Nested Doughnut Chart
- 3 minutes to read
Short Description
The Nested Doughnut Chart is represented by the NestedDoughnutSeriesView object, which belongs to Pie, Doughnut and Funnel Series Views. This view is similar to the Doughnut series view, but compares series with one doughnut nested in another one.
In the image below, the Nested Doughnut chart shows the populations of the United States, Brazil and Russia based on age and grouped by gender (Female and Male series).
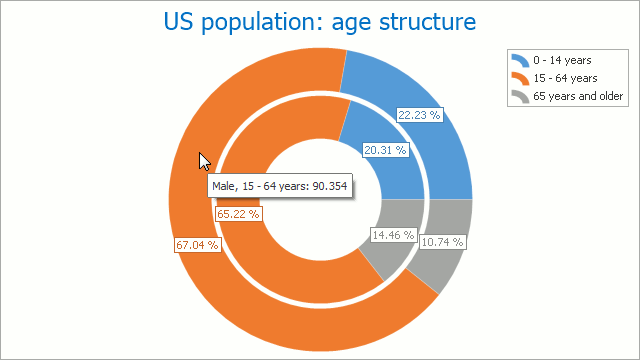
Note that to control the size of the nested doughnut’s hole, use the DoughnutSeriesView.HoleRadiusPercent property. In the above image, for example, this property is set to 40.
You can define an inner indent between nested doughnuts (NestedDoughnutSeriesView.InnerIndent), specify the relative size for nested doughnut series (NestedDoughnutSeriesView.Weight), and create groups for similar Nested Doughnut series (NestedDoughnutSeriesView.Group).
Chart Type Characteristics
The table below lists the main characteristics of this chart type.
| Feature | Value |
|---|---|
| Series View type | NestedDoughnutSeriesView |
| Diagram type | 2D-SimpleDiagram |
| Number of arguments per series point | 1 |
| Number of values per series point | 1 |
Note
For information on which chart types can be combined with the Nested Doughnut Chart, refer to the Combining Different Series Views document.
Example
The following example demonstrates how to create a ChartControl with a series of the NestedDoughnutSeriesView type, set its general properties, and add this chart to a form at runtime. Before proceeding with this example, create a Windows Forms Application in Visual Studio, and add all required assemblies in the References list of your project.
Then, add the following code to the Form.Load event handler.
Note
A complete sample project is available at https://github.com/DevExpress-Examples/how-to-create-a-nested-doughnut-chart-e5221
using System;
using System.Windows.Forms;
using DevExpress.Utils;
using DevExpress.XtraCharts;

namespace NestedDoughnut {
    public partial class Form1 : Form {
        public Form1() {
            InitializeComponent();
        }

        private void Form1_Load(object sender, EventArgs e) {
            // Create a new chart.
            ChartControl NestedDoughnutChart = new ChartControl();

            // Add the chart to the form.
            NestedDoughnutChart.Dock = DockStyle.Fill;
            this.Controls.Add(NestedDoughnutChart);

            // Create a first nested doughnut series.
            Series series1 = new Series("Male", ViewType.NestedDoughnut);

            // Populate the series with points.
            series1.Points.Add(new SeriesPoint("0-14 years", 29.956));
            series1.Points.Add(new SeriesPoint("15-64 years", 25.607));
            series1.Points.Add(new SeriesPoint("65 years and older", 13.493));

            // Add the first series to the chart.
            NestedDoughnutChart.Series.Add(series1);

            // Create a second nested doughnut series.
            Series series2 = new Series("Female", ViewType.NestedDoughnut);

            // Populate the series with points.
            series2.Points.Add(new SeriesPoint("0-14 years", 90.354));
            series2.Points.Add(new SeriesPoint("15-64 years", 55.793));
            series2.Points.Add(new SeriesPoint("65 years and older", 48.983));

            // Add the second series to the chart.
            NestedDoughnutChart.Series.Add(series2);

            // Specify the hole radius percentage and inner indent of the nested doughnut.
            ((NestedDoughnutSeriesView)series1.View).InnerIndent = 8;
            ((NestedDoughnutSeriesView)series1.View).HoleRadiusPercent = 30;

            // Specify the legend text pattern for the first series.
            series1.LegendTextPattern = "{A}";

            // Hide a legend for the second series.
            series2.ShowInLegend = false;

            // Enable a tooltip and specify the tooltip point pattern for series.
            NestedDoughnutChart.ToolTipEnabled = DefaultBoolean.True;
            series1.ToolTipPointPattern = "{S}:{VP:##.##%}";
            series2.ToolTipPointPattern = "{S}:{VP:##.##%}";

            // Hide series labels.
            series1.LabelsVisibility = DefaultBoolean.False;
            series2.LabelsVisibility = DefaultBoolean.False;

            // Add a title to the chart.
            ChartTitle chartTitle1 = new ChartTitle();
            chartTitle1.Text = "Nested Doughnut Chart";
            NestedDoughnutChart.Titles.Add(chartTitle1);
        }
    }
}