Adding Panes
- 2 minutes to read
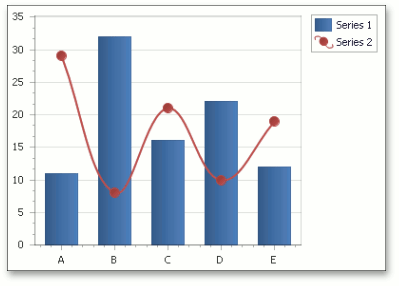
This document describes how new panes can be added to a chart’s diagram at design time. Before reading this text, you may wish to review the basics of using panes in the ASP.NET Chart Control.
This document consists of the following sections.
Adding Panes
To quickly assign a new pane to a series at design time, do the following.
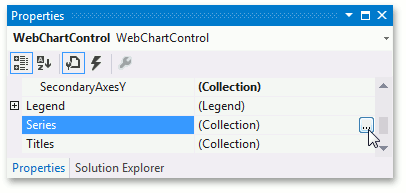
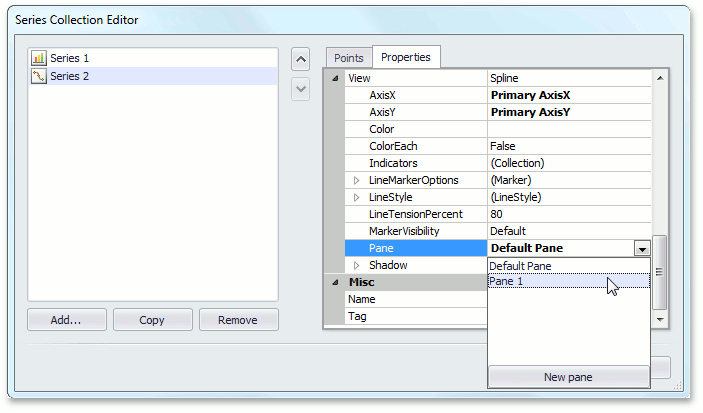
Invoke the Series Collection Editor by clicking the Series ellipsis button in the Properties window.
- Switch to the Properties tab in the Series Collection Editor, expand the series view and locate the XYDiagramSeriesViewBase.Pane property.
Click New pane in the drop-down menu of the XYDiagramSeriesViewBase.Pane property.
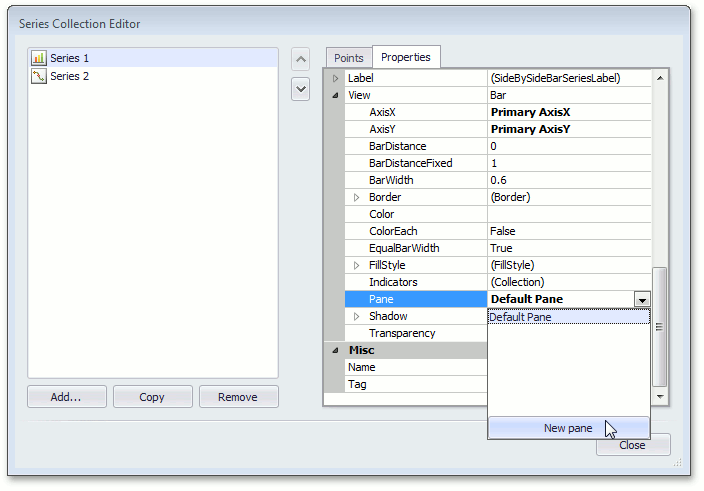
Click Close, to apply the changes and quit the dialog.
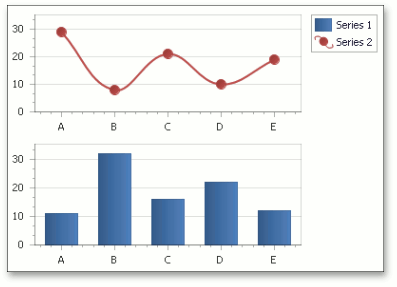
Then, a new pane with default settings will be created and associated with the current series, automatically.
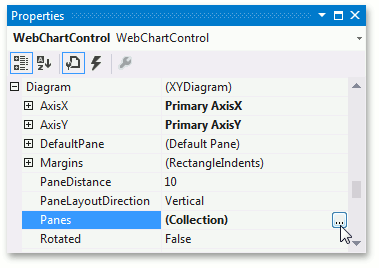
Additional panes reside in the diagram’s collection, which can be accessed from the XYDiagram2D.Panes property. So, if you need to access the collection of panes (to create a new additional pane, or to customize the existing ones) at design time, select your chart, and in the Properties window, expand the WebChartControl.Diagram property. In the list of its options, locate the XYDiagram2D.Panes property and click its ellipsis button.
This invokes the Pane Collection Editor.
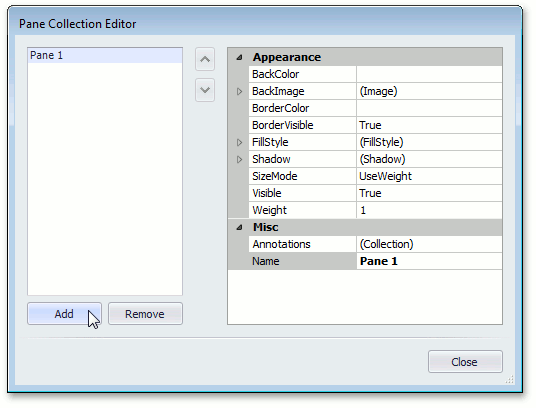
In this dialog, click Add to create a new pane, and then use the available properties to customize its size and appearance. These properties are briefly described in the Panes Alignment and Panes Appearance topics.
To apply the changes and quit the dialog, click Close.
Then, to associate the created pane with an existing series, assign the pane to this series using the XYDiagramSeriesViewBase.Pane property in the Properties tab of the Series Collection Editor. To learn more on how to invoke this editor at design time, see the Adding Panes document section.
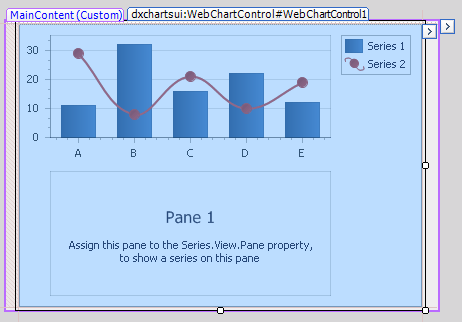
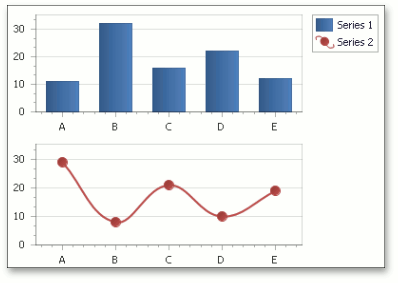
To apply the changes and quit the dialog, click Close. After that, the chart should look like the following.
Examples
The following step-by-step examples related to multi-pane charts creation are available.
- How to: Create a Multi-Pane Chart
- How to: Display a Series in an Additional Pane (Runtime Sample)
- How to: Display Automatically Created Series in Separate Panes
- How to: Bind Series to Data and Display Them In Separate Panes (Runtime Sample)
- How to: Customize the Appearance of a Pane’s Scroll Bar (Runtime Sample)