Customize a Series
- 2 minutes to read
This document describes the most important options of a series.
To quickly access the options of a series, click your web chart control’s smart tag, and in its actions list, choose the Series… link.
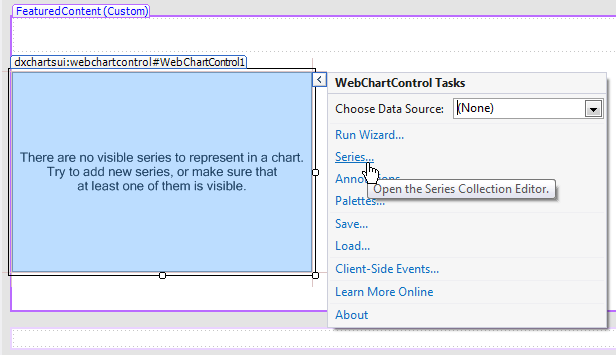
This invokes the Series Collection Editor.
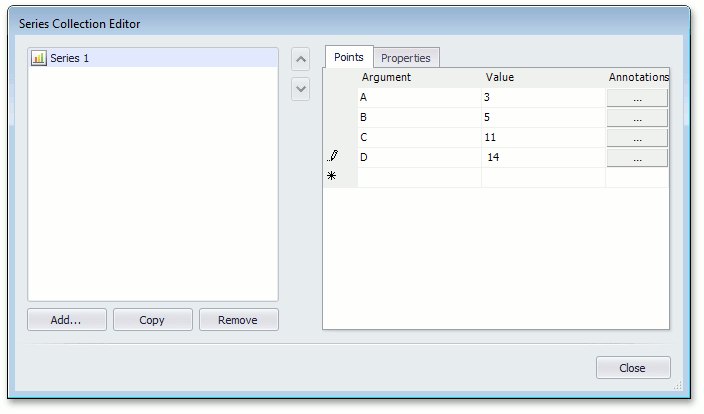
If the series collection does not have a chart series, add it in the Series Collection Editor as follows.
- Add a series to the series collection by clicking the Add… button;
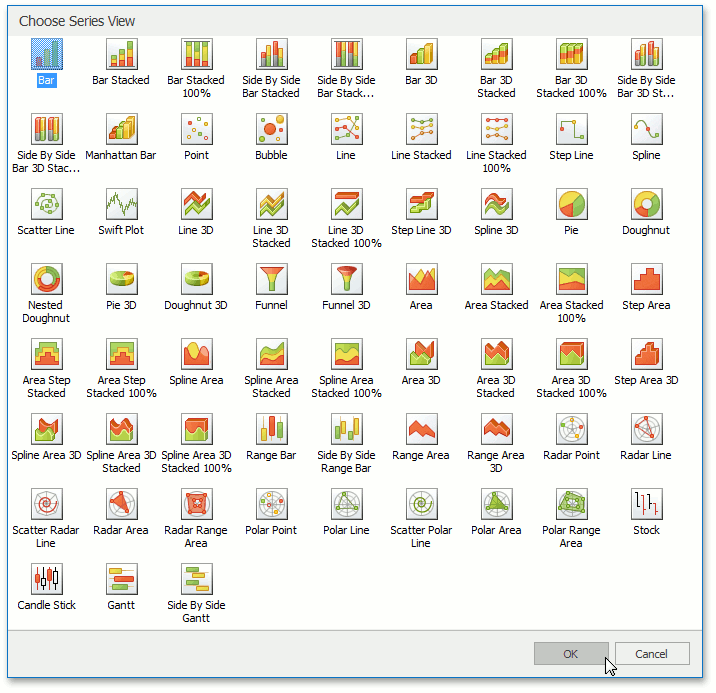
In the invoked Choose Series View dialog, select the desired series and click OK.
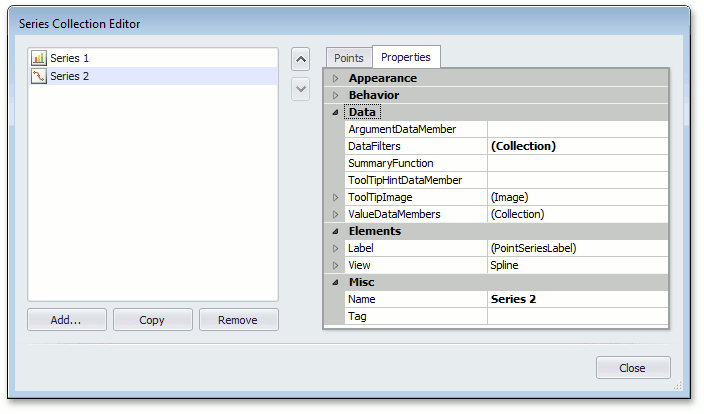
To access the series properties, select a series, and on the right side of the Series Collection Editor, switch to the Properties tab.
The available series options are organized into several groups. They are listed below.
Appearance
In this group, only the SeriesBase.Visible and SeriesBase.LabelsVisibility properties are available. Note that until a chart has at least one visible series, it is empty and displays a notification instead of a diagram.
Behavior
In this group, you can specify the scale types for the series argument and value(s), apply series point sorting, enable the Top-N feature, adjust how the series is represented in the legend (SeriesBase.ShowInLegend, SeriesBase.CheckableInLegend, SeriesBase.CheckedInLegend, SeriesBase.LegendText and SeriesBase.LegendPointOptions), enable the crosshair cursor and tooltips (SeriesBase.CrosshairEnabled, SeriesBase.ToolTipEnabled), customize the crosshair label, tooltip point and series patterns (SeriesBase.CrosshairLabelPattern, SeriesBase.ToolTipPointPattern, SeriesBase.ToolTipSeriesPattern), and control the crosshair label visibility (SeriesBase.CrosshairLabelVisibility).
Data
In this group, you can specify options for series binding, apply data filtering and calculating summaries, define a tooltip hint data member (SeriesBase.ToolTipHintDataMember), and specify a tooltip image (Series.ToolTipImage).
Elements
In this group, there are two major sets of options available: the series point label options (which control label appearance and resolve overlapping options, and the options specific to the series view type.
Misc
In this group, you can specify the series name (Series.Name), and mark it with a tag (ChartElement.Tag).
To apply the changes and quit the dialog, click Close.