Spline Chart
- 3 minutes to read
Short Description
The Spline Chart is represented by the SplineSeriesView object, which belongs to Point, Line and Spline Series Views. This view is similar to the Line Chart, but plots a fitted curve through each data point in a series.
A Spline chart is shown in the image below. Note that this chart type is based upon the XYDiagram, so it can be rotated to show bars either vertically or horizontally.
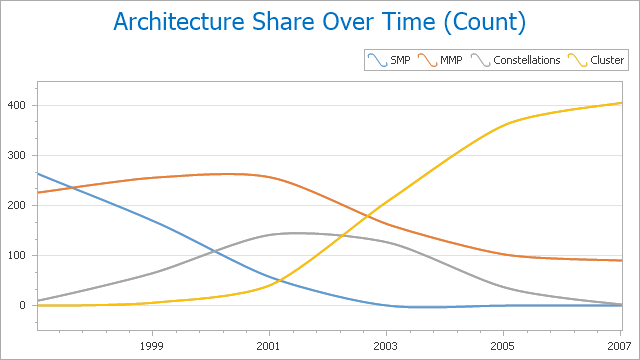
Chart Type Characteristics
The table below lists the main characteristics of this chart type.
| Feature | Value |
|---|---|
| Series View type | SplineSeriesView |
| Diagram type | 2D-XYDiagram |
| Number of arguments per series point | 1 |
| Number of values per series point | 1 |
Note
For information on which chart types can be combined with the Spline Chart, refer to the following help topic: Combining Different Series Views.
Example
The following example creates a ChartControl with a series of the SplineSeriesView type, sets its general properties, and adds this chart to a form at runtime. Before proceeding with this example, first create a Windows Forms Application in Visual Studio, and add all required assemblies to the project’s References list.
Then, add the following code to the Form.Load event handler.
using System;
using System.Windows.Forms;
using DevExpress.XtraCharts;
// ...

private void Form1_Load(object sender, EventArgs e) {
    // Create a new chart.
    ChartControl splineChart = new ChartControl();

    // Create a spline series.
    Series series1 = new Series("Series 1", ViewType.Spline);

    // Add points to it.
    series1.Points.Add(new SeriesPoint(1, 3));
    series1.Points.Add(new SeriesPoint(2, 12));
    series1.Points.Add(new SeriesPoint(3, 4));
    series1.Points.Add(new SeriesPoint(4, 17));
    series1.Points.Add(new SeriesPoint(5, 3));
    series1.Points.Add(new SeriesPoint(6, 12));
    series1.Points.Add(new SeriesPoint(7, 4));
    series1.Points.Add(new SeriesPoint(8, 17));

    // Add the series to the chart.
    splineChart.Series.Add(series1);

    // Set the numerical argument scale types for the series,
    // as it is qualitative, by default.
    series1.ArgumentScaleType = ScaleType.Numerical;

    // Access the view-type-specific options of the series.
    ((SplineSeriesView)series1.View).LineTensionPercent = 90;

    // Access the type-specific options of the diagram.
    ((XYDiagram)splineChart.Diagram).EnableAxisXZooming = true;

    // Hide the legend (if necessary).
    splineChart.Legend.Visible = false;

    // Add a title to the chart (if necessary).
    splineChart.Titles.Add(new ChartTitle());
    splineChart.Titles[0].Text = "A Spline Chart";

    // Add the chart to the form.
    splineChart.Dock = DockStyle.Fill;
    this.Controls.Add(splineChart);
}