Polar Line Chart
- 3 minutes to read
Short Description
The Polar Line Chart is represented by the PolarLineSeriesView object, which belongs to Polar Series Views. This view is useful when it’s necessary to show trends for several series and compare their values for the same points arguments on a circular diagram on the basis of angles. Note that although these charts normally have a circular shape, they can also be displayed as a polygon. This is controlled via the RadarDiagram.DrawingStyle property.
A Polar Line chart is shown in the image below.
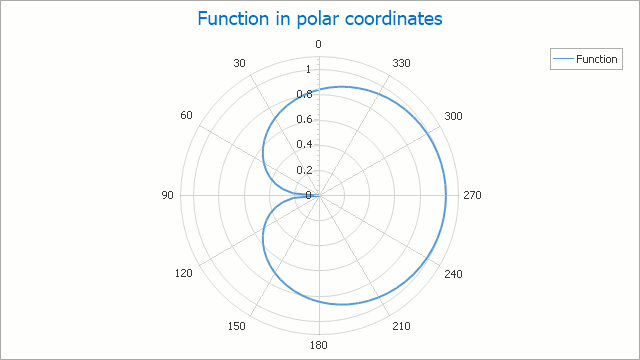
Chart Type Characteristics
The table below lists the main characteristics of this chart type.
| Feature | Value |
|---|---|
| Series View type | PolarLineSeriesView |
| Diagram type | PolarDiagram |
| Number of arguments per series point | 1 |
| Number of values per series point | 1 |
Note
For information on which chart types can be combined with the Polar Line Chart, refer to the Combining Different Series Views document.
Example
The following example demonstrates how to create a ChartControl with a series of the PolarLineSeriesView type, set its general properties, and add this chart to a form at runtime. Before proceeding with this example, first create a Windows Forms Application in Visual Studio, and include all necessary assemblies to the References list of your project.
Then, add the following code to the Form.Load event handler.
using System;
using System.Windows.Forms;
using DevExpress.XtraCharts;
// ...

private void Form1_Load(object sender, EventArgs e) {
    // Create a new chart.
    ChartControl polarLineChart = new ChartControl();

    // Add a polar series to it.
    Series series1 = new Series("Series 1", ViewType.PolarLine);

    // Populate the series with points.
    series1.Points.Add(new SeriesPoint(0, 90));
    series1.Points.Add(new SeriesPoint(90, 70));
    series1.Points.Add(new SeriesPoint(180, 50));
    series1.Points.Add(new SeriesPoint(270, 100));

    // Add the series to the chart.
    polarLineChart.Series.Add(series1);

    // Flip the diagram (if necessary).
    ((PolarDiagram)polarLineChart.Diagram).StartAngleInDegrees = 180;
    ((PolarDiagram)polarLineChart.Diagram).RotationDirection =
        RadarDiagramRotationDirection.Counterclockwise;

    // Add a title to the chart and hide the legend.
    ChartTitle chartTitle1 = new ChartTitle();
    chartTitle1.Text = "Polar Line Chart";
    polarLineChart.Titles.Add(chartTitle1);
    polarLineChart.Legend.Visible = false;

    // Add the chart to the form.
    polarLineChart.Dock = DockStyle.Fill;
    this.Controls.Add(polarLineChart);
}
Tip
A complete sample project is available in the DevExpress Code Examples database at http://www.devexpress.com/example=E1056.