Full-Stacked Area Chart
- 4 minutes to read
Short Description
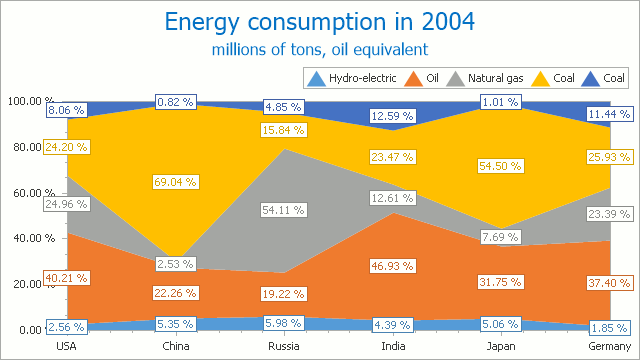
The Full-Stacked Area Chart (100% Stacked Area Chart) is represented by the FullStackedAreaSeriesView object, which belongs to Area Series Views. This view displays series as areas on a diagram, so that the value of each data point is stacked with all other corresponding data point values. In this instance, the height of the area is always the full height of the chart diagram (i.e., 1). This view allows you to compare the percentage values of multiple series for the same point arguments.
A Full-Stacked Area chart is shown in the image below. Note that this chart type is based upon the XYDiagram, so it can be rotated to show bars either vertically or horizontally.
Note
A Full-Stacked Area chart can display series containing data points with positive or negative values. However, a series with positive values is stacked only with other series containing positive values; and a series with negative values is stacked with other series containing negative values.
Note that if a series contains data points with both positive and negative values, it is treated as a series with positive values, while all its negative values are treated as zeros.
Chart Type Characteristics
The table below lists the main characteristics of this chart type.
| Feature | Value |
|---|---|
| Series View type | FullStackedAreaSeriesView |
| Diagram type | 2D-XYDiagram |
| Number of arguments per series point | 1 |
| Number of values per series point | 1 |
Note
For information on which chart types can be combined with the Full-Stacked Area Chart, refer to the following help topic: Combining Different Series Views.
Example
The following example creates a ChartControl with two series of the FullStackedAreaSeriesView type, and adds this chart to a form at runtime. Before proceeding with this example, create a Windows Forms Application in Visual Studio, and add all required assemblies to the project’s References list.
Then, add the following code to the Form.Load event handler.
using DevExpress.XtraCharts;
// ...

private void Form1_Load(object sender, EventArgs e) {
    // Create a new chart.
    ChartControl FullStackedAreaChart = new ChartControl();

    // Create two full-stacked area series.
    Series series1 = new Series("Series 1", ViewType.FullStackedArea);
    Series series2 = new Series("Series 2", ViewType.FullStackedArea);

    // Add points to them.
    series1.Points.Add(new SeriesPoint(1, 10));
    series1.Points.Add(new SeriesPoint(2, 12));
    series1.Points.Add(new SeriesPoint(3, 14));
    series1.Points.Add(new SeriesPoint(4, 17));

    series2.Points.Add(new SeriesPoint(1, 15));
    series2.Points.Add(new SeriesPoint(2, 18));
    series2.Points.Add(new SeriesPoint(3, 25));
    series2.Points.Add(new SeriesPoint(4, 33));

    // Add both series to the chart.
    FullStackedAreaChart.Series.AddRange(new Series[] { series1, series2 });

    // Set the numerical argument scale types for the series,
    // as it is qualitative, by default.
    series1.ArgumentScaleType = ScaleType.Numerical;
    series2.ArgumentScaleType = ScaleType.Numerical;

    // Access the view-type-specific options of the series.
    ((FullStackedAreaSeriesView)series1.View).Transparency = 50;
    ((FullStackedAreaSeriesView)series2.View).Transparency = 50;

    // Access the type-specific options of the diagram.
    ((XYDiagram)FullStackedAreaChart.Diagram).EnableAxisXZooming = true;

    // Hide the legend (if necessary).
    FullStackedAreaChart.Legend.Visible = false;

    // Add the chart to the form.
    FullStackedAreaChart.Dock = DockStyle.Fill;
    this.Controls.Add(FullStackedAreaChart);
}