Doughnut Chart
- 4 minutes to read
Short Description
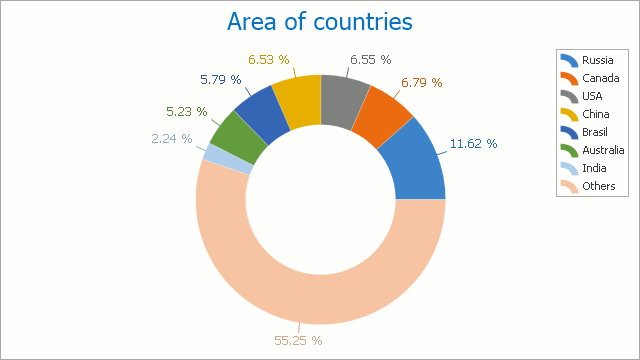
The Doughnut Chart is represented by the DoughnutSeriesView object, which belongs to Pie, Doughnut and Funnel Series Views. This view allows you to compare the percentage values of different point arguments in the same series, and display these values as easy-to-understand pie slices, but with a hole in the center.
A Doughnut chart is shown in the image below. Note that if a chart contains multiple series of the DoughnutSeriesView type (as well as PieSeriesView), all series are displayed in the same diagram based on the SimpleDiagram.Dimension and SimpleDiagram.LayoutDirection property values.
Use the DoughnutSeriesView.HoleRadiusPercent (or Doughnut3DSeriesView.HoleRadiusPercent) property to control the size of the doughnut’s hole. For example, in the above image, this property is set to 0 for the left chart.
Chart Type Characteristics
The table below lists the main characteristics of this chart type.
| Feature | Value |
|---|---|
| Series View type | DoughnutSeriesView |
| Diagram type | 2D-SimpleDiagram |
| Number of arguments per series point | 1 |
| Number of values per series point | 1 |
Note
For information on which chart types can be combined with the Doughnut Chart, refer to the following help topic: Combining Different Series Views.
Example
The following example creates a ChartControl with a series of the DoughnutSeriesView type, sets its general properties, and adds this chart to a form at runtime. Before proceeding with this example, create a Windows Forms Application in Visual Studio, and add all required assemblies to the project’s References list.
Then, add the following code to the Form.Load event handler.
using System;
using System.Windows.Forms;
using DevExpress.XtraCharts;

namespace Series_DoughnutChart {
    public partial class Form1 : Form {
        public Form1() {
            InitializeComponent();
        }

        private void Form1_Load(object sender, EventArgs e) {
            // Create a new chart.
            ChartControl DoughnutChart = new ChartControl();

            // Create a doughnut series.
            Series series1 = new Series("Series 1", ViewType.Doughnut);

            // Populate the series with points.
            series1.Points.Add(new SeriesPoint("Russia", 17.0752));
            series1.Points.Add(new SeriesPoint("Canada", 9.98467));
            series1.Points.Add(new SeriesPoint("USA", 9.63142));
            series1.Points.Add(new SeriesPoint("China", 9.59696));
            series1.Points.Add(new SeriesPoint("Brazil", 8.511965));
            series1.Points.Add(new SeriesPoint("Australia", 7.68685));
            series1.Points.Add(new SeriesPoint("India", 3.28759));
            series1.Points.Add(new SeriesPoint("Others", 81.2));

            // Add the series to the chart.
            DoughnutChart.Series.Add(series1);

            // Specify the text pattern of series labels.
            series1.Label.TextPattern = "{A}: {VP:P0}";

            // Specify how series points are sorted.
            series1.SeriesPointsSorting = SortingMode.Ascending;
            series1.SeriesPointsSortingKey = SeriesPointKey.Argument;

            // Specify the behavior of series labels.
            ((DoughnutSeriesLabel)series1.Label).Position = PieSeriesLabelPosition.TwoColumns;
            ((DoughnutSeriesLabel)series1.Label).ResolveOverlappingMode = ResolveOverlappingMode.Default;
            ((DoughnutSeriesLabel)series1.Label).ResolveOverlappingMinIndent = 5;

            // Adjust the view-type-specific options of the series.
            ((DoughnutSeriesView)series1.View).ExplodedPoints.Add(series1.Points[0]);
            ((DoughnutSeriesView)series1.View).ExplodedDistancePercentage = 30;

            // Access the diagram's options.
            ((SimpleDiagram)DoughnutChart.Diagram).Dimension = 2;

            // Add a title to the chart and hide the legend.
            ChartTitle chartTitle1 = new ChartTitle();
            chartTitle1.Text = "2D Doughnut Chart";
            DoughnutChart.Titles.Add(chartTitle1);
            DoughnutChart.Legend.Visibility = DevExpress.Utils.DefaultBoolean.False;

            // Add the chart to the form.
            DoughnutChart.Dock = DockStyle.Fill;
            this.Controls.Add(DoughnutChart);
        }

    }
}
Tip
For the complete sample project, see the following DevExpress Support Center example: https://supportcenter.devexpress.com/ticket/details/e1047/how-to-create-a-doughnut-chart.