Area Chart
- 3 minutes to read
Short Description
The Area Chart is represented by the AreaSeriesView object, which belongs to Area Series Views. This view displays series as filled areas on a diagram, with each data point displayed as a peak or valley in the area. It is useful when you need to show trends for several series on a single diagram, and show the relationship of the parts to the whole.
An Area chart is shown in the image below. Note that this chart type is based on the XYDiagram, so it can be rotated to show bars either vertically or horizontally.
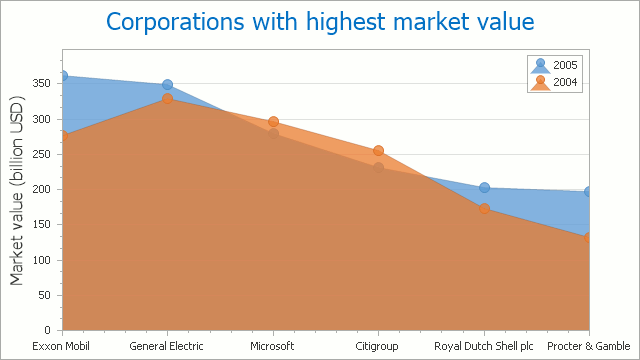
Chart Type Characteristics
The table below lists the main characteristics of this chart type.
| Feature | Value |
|---|---|
| Series View type | AreaSeriesView |
| Diagram type | 2D-XYDiagram |
| Number of arguments per series point | 1 |
| Number of values per series point | 1 |
Note
For information on chart types that can be combined with the Area Chart, refer to the Series Views Compatibility document.
Example
The following example demonstrates how to create a ChartControl with two series of the AreaSeriesView type, and add this chart to a form at runtime. Before proceeding with this example, create a Windows Forms Application in Visual Studio, and add all required assemblies to the References list of your project.
Then, add the following code to the Form.Load event handler.
using DevExpress.XtraCharts;
// ...

private void Form1_Load(object sender, EventArgs e) {
    // Create a new chart.
    ChartControl areaChart = new ChartControl();

    // Create two area series.
    Series series1 = new Series("Series 1", ViewType.Area);
    Series series2 = new Series("Series 2", ViewType.Area);

    // Add points to them.
    series1.Points.Add(new SeriesPoint(1, 15));
    series1.Points.Add(new SeriesPoint(2, 18));
    series1.Points.Add(new SeriesPoint(3, 25));
    series1.Points.Add(new SeriesPoint(4, 33));

    series2.Points.Add(new SeriesPoint(1, 10));
    series2.Points.Add(new SeriesPoint(2, 12));
    series2.Points.Add(new SeriesPoint(3, 14));
    series2.Points.Add(new SeriesPoint(4, 17));

    // Add both series to the chart.
    areaChart.Series.AddRange(new Series[] { series1, series2 });

    // Set the numerical argument scale types for the series,
    // as it is qualitative, by default.
    series1.ArgumentScaleType = ScaleType.Numerical;
    series2.ArgumentScaleType = ScaleType.Numerical;

    // Access the view-type-specific options of the series.
    ((AreaSeriesView)series1.View).Transparency = 80;

    // Access the type-specific options of the diagram.
    ((XYDiagram)areaChart.Diagram).EnableAxisXZooming = true;

    // Hide the legend (optional).
    areaChart.Legend.Visible = false;

    // Add the chart to the form.
    areaChart.Dock = DockStyle.Fill;
    this.Controls.Add(areaChart);
}
Tip
A complete sample project is available in the DevExpress Code Examples database at http://www.devexpress.com/example=E146.