Advanced Charting
- 2 minutes to read
This help topic describes advanced features that provide a professional look to a complex chart.
Complex Data Representation
The XY-Diagram supports an unlimited number of additional panes and secondary axes - to display complex, diverse data structures in your chart.
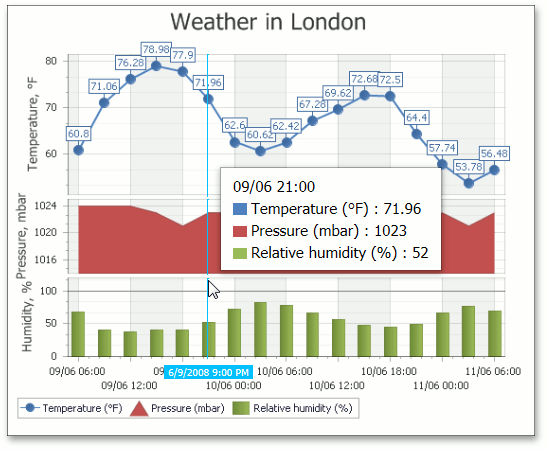
With the crosshair cursor interaction tool, you can allow end users to track series point coordinates on a chart - to analyze data by comparing different graphs. For more information, see the following help topic: Crosshair Cursor.
Flexible Axis Scale
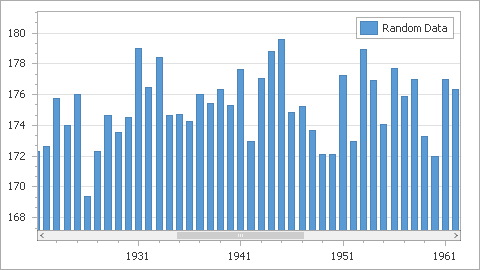
Automatic and Manual Scale Ranges
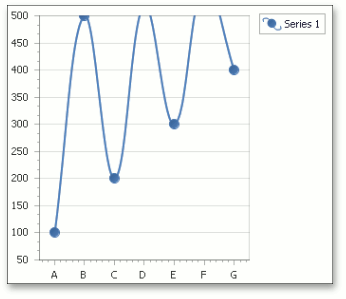
The ASP.NET Chart Control analyzes incoming data and automatically adjusts the range of its axes to fit all series points. You can also manually limit or extend an axis range.
Smart Date-Time Scale
When a series uses the date-time argument scale type, you can utilize automatic date-time modes. See the following help topic to learn more: Data Aggregation.
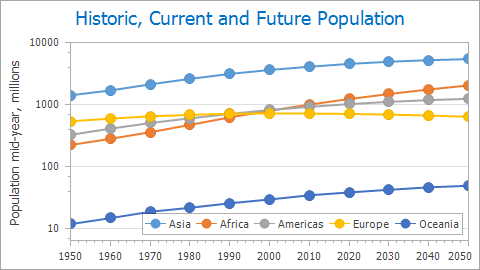
Logarithmic Scale
For numeric data, you can enable the AxisBase.Logarithmic property of an axis.
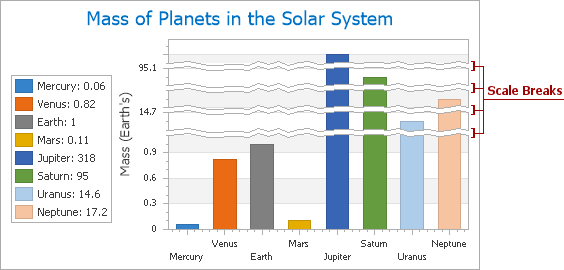
Automatic and Manual Scale Breaks
When the AutoScaleBreaks.Enabled property is set to true, the ASP.NET Chart Control automatically inserts scale breaks (up to the specified number) in an axis range if the chart’s data contains data points with a large value difference.
Alternatively, a chart’s axis can contain manually added scale breaks to decrease the distance between data points with a large value difference.
Comprehensive Explanatory Capabilities
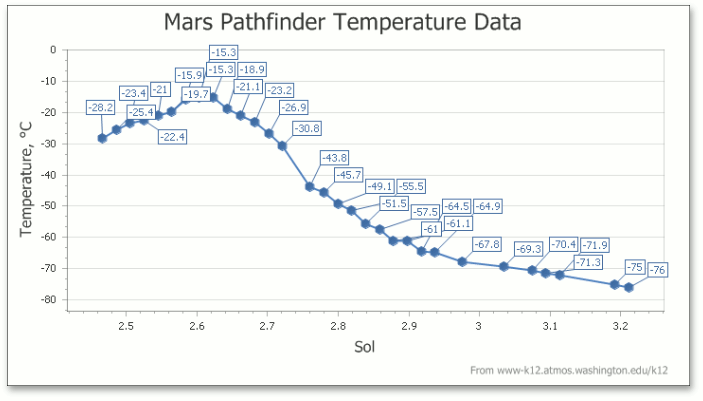
Smart Series Point Labels
The ASP.NET Chart Control resolves series label overlap, which occurs when a chart displays multiple series data points with series point labels. You can specify a predefined algorithm to prevent label overlap. See the following help topic for more information: Series Point Labels.
Interactive Text and Image Annotations
You can also add an unlimited number of text or image annotations to your chart. These annotations can be anchored to any point on a chart’s surface, a diagram coordinate or a series point.
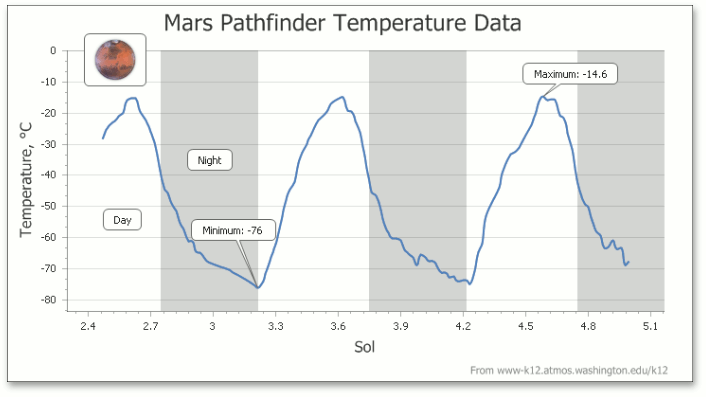
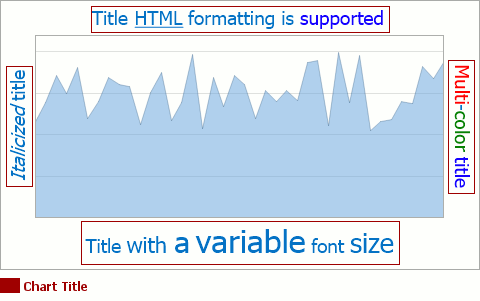
Chart Titles
You can create an unlimited number of chart titles with HTML and word-wrap support, and position them freely onto your chart.
Enhanced Legend Capabilities
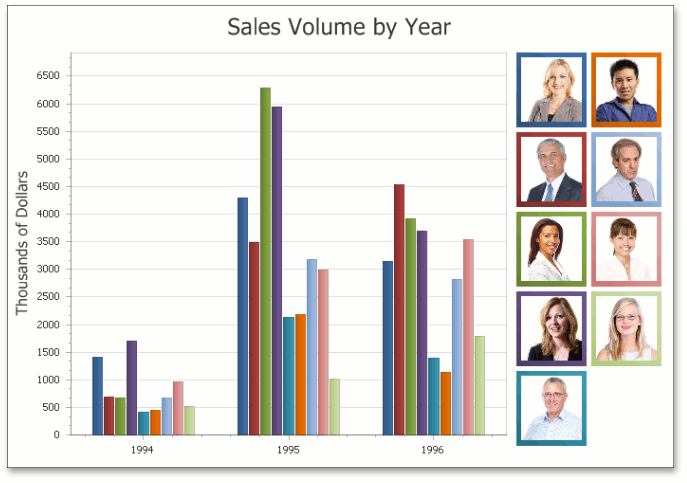
You can use special event handlers to fully customize the appearance and layout of legend items. For instance, you can change the marker appearance (colors, fill style, size and visibility) or adjust text options (font, color and visibility).
You can also specify custom images for legend item markers.