Fibonacci Indicators
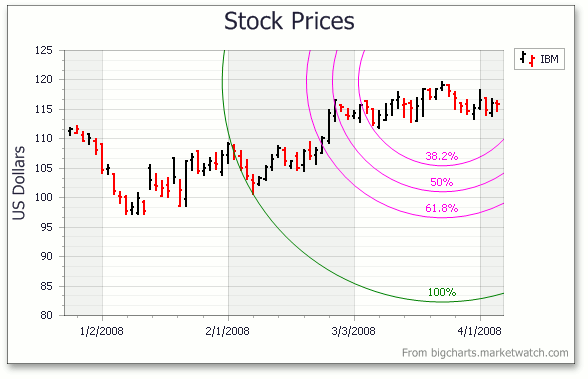
Fibonacci Indicators are a common data analysis instrument that allow you to add various forms of Fibonacci sequences to your chart’s visual data. These indicators are primarily used in Stock and Candle Stick chart applications. They may also be utilized with other XY-series.
Fibonacci Indicators reside in the XYDiagram2DSeriesViewBase.Indicators collection of a series, along with other indicators. A series may have any number of Fibonacci Indicators. Refer to the following help topic for more information: Fibonacci Indicators.
The following types of Fibonacci Indicators are available, each with its own appearance and special set of options.
- Fibonacci Arcs;
- Fibonacci Fans;
- Fibonacci Retracement.
The table below lists the main properties that affect the element’s appearance and functionality.
Class | The FibonacciIndicator class (which is a descendant of the Indicator class) |
Availability | |
Points | |
Kind | |
Specific Options | FibonacciIndicator.ShowAdditionalLevels, FibonacciIndicator.ShowLevel0, FibonacciIndicator.ShowLevel23_6, FibonacciIndicator.ShowLevel76_4 and FibonacciIndicator.ShowLevel100 |
Appearance | WebChartControl.IndicatorsPaletteName, Indicator.Color and Indicator.LineStyle |
Visibility and Legend Availability | Indicator.Visible and Indicator.ShowInLegend, Indicator.CheckedInLegend |