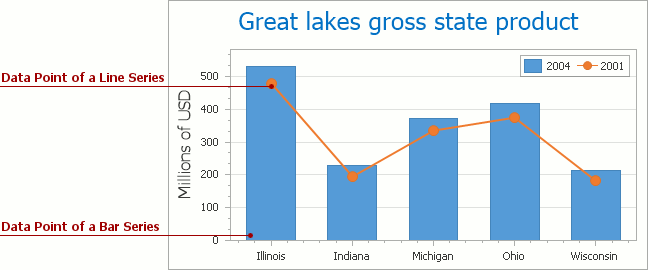
Series Data Point
A Series Data Point (or a Series Point, for short) is an individual data point within a series. The chart plots each data point on the diagram based upon one X value (the point’s argument) and one or more Y values (the value(s) of the data point). Series point appearance (a bar, data point marker, pie slice) depends on the view type of the series to which the point belongs. Each series point can be displayed with a series label that identifies the point. For more detailed information, refer to Series Points.
The table below lists the main properties that affect the element’s appearance and functionality:
Availability | The Series.Points property of a series, the SeriesPointCollection.Item of a point collection. |
Appearance | |
Values | |
Behavior | SeriesBase.SeriesPointsSorting, SeriesBase.SeriesPointsSortingKey |
Custom Draw Event |