Panes
The XY-Diagram can display one or more Panes. The pane is a rectangular area used to display axes (along with their grid lines, constant lines, regression lines, strips, etc.) and to plot the data points of one or more series.
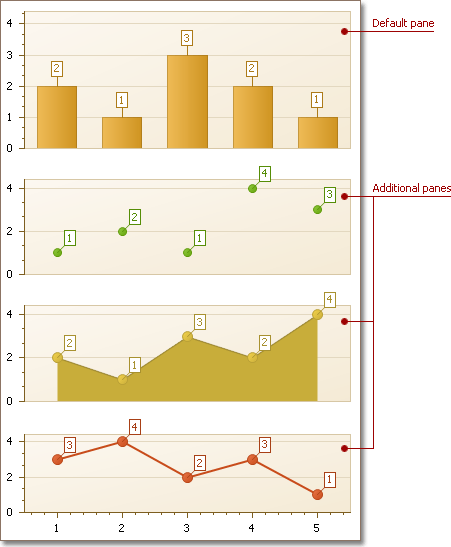
A diagram displays a single default pane, which is accessible from the XYDiagram2D.DefaultPane property. If a diagram contains several series, it is possible to display each series on a separate pane. For this, add a new pane to the XYDiagram2D.Panes collection (which is initially empty) and set the Series.View.Pane property to this pane.
Also, if the same axis is used by several series, and these series are shown in different panes, you can customize the axis visibility using its Axis2D.VisibilityInPanes property.
The table below lists the main properties that affect the element’s appearance and functionality:
Class | The XYDiagramPaneBase class descendants (XYDiagramPane and XYDiagramDefaultPane). |
Availability | |
Layout | |
Appearance | XYDiagramPaneBase.BackColor, XYDiagramPaneBase.BackImage, XYDiagramPaneBase.BorderColor, XYDiagramPaneBase.BorderVisible, XYDiagramPaneBase.FillStyle, XYDiagramPaneBase.Shadow |
Size |