Lesson 2 - Bind a Pivot Grid to an OLAP Cube
- 2 minutes to read
A cube is a multidimensional structure defined by its measures and dimensions. You can think of a measure as a data field in ASPxPivotGrid, while a column field or a row field represents its dimension. This tutorial describes how to bind a pivot grid to an existing OLAP (OnLine Analytical Processing) cube. In this example, we are using the Northwind cube.
Note
Download the completed project: Bind a Pivot Grid to an OLAP Cube (Runtime sample)
To display data from an OLAP cube, do the following:
- Run MS Visual Studio. Create a new ASP.NET Web application using the DevExpress Template Gallery (see Lesson 1, Steps 1-6).
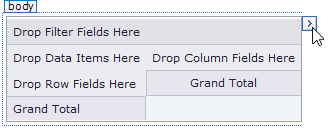
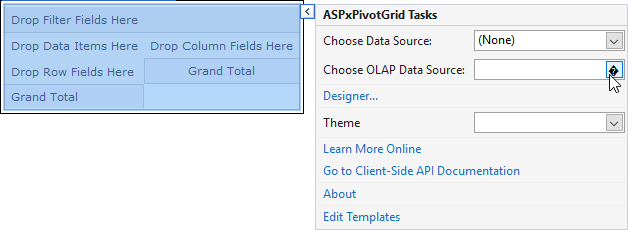
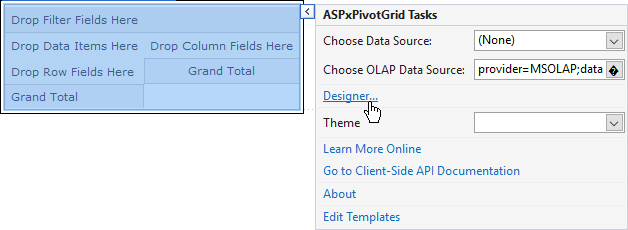
Click the smart tag icon displayed at the top-right of the pivot grid to invoke the ASPxPivotGrid Tasks popup window.
In this window, click the ellipsis button in the Choose OLAP Data Source field.
This invokes the Connection String Editor window.
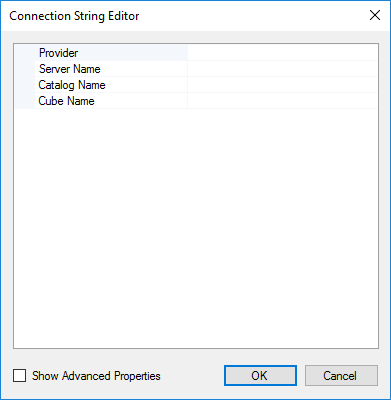
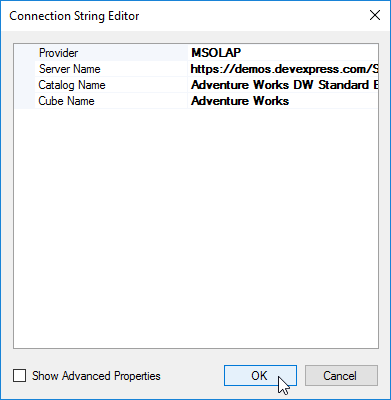
In the Connection String Editor, specify the following parameters:
Provider
MSOLAP
Identifies the data provider to be used. The “MSOLAP“ string identifies the latest version of the OLE DB provider.
Server Name
https://demos.devexpress.com/Services/OLAP/msmdpump.dll
Specifies either the name of a server that runs an instance of Microsoft SQL Server Analysis Services (SSAS), the path to a cube file or the path to a data pump.
Catalog Name
Adventure Works DW Standard Edition
Specifies a data catalog that contains cubes.
Cube Name
Adventure Works
Specifies the name of a cube that provides OLAP data.
Click OK to save the connection parameters.
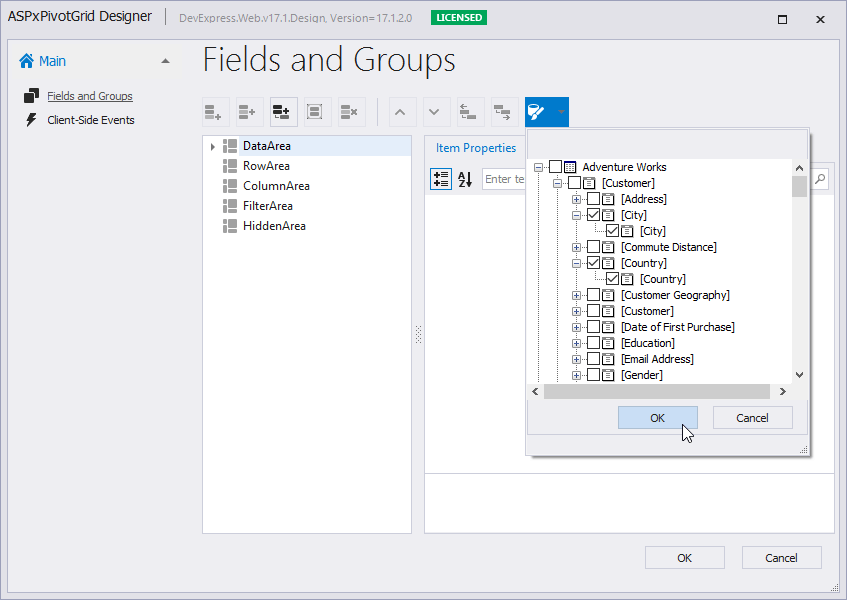
In ASPxPivotGrid, create fields that represent specific measures and dimension levels of the cube.
Click the smart tag and then click the Designer… item. This invokes the ASPxPivotGrid Designer.
Select the Data Area and click the Retrieve Fields button (the
 icon) to retrieve fields to this area. Select the following fields from the drop-down list:
- [Customer].[City].[City]
- [Customer].[Country].[Country]
- [Date].[Fiscal].[Fiscal Year]
- [Date].[Fiscal].[Fiscal Quarter]
- [Measures].[Internet Sales Amount]
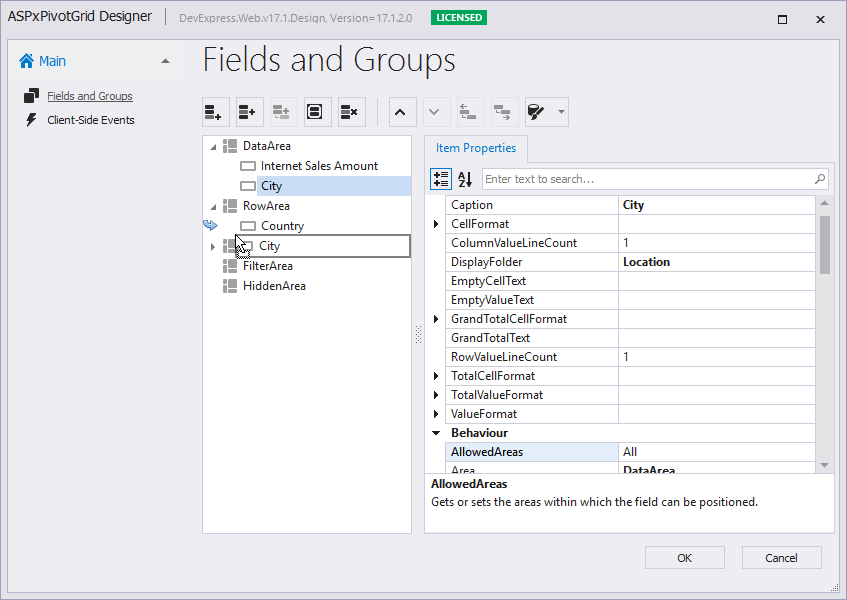
Use drag-and-drop to move fields between areas. You can also move fields between areas by using the Item Properties pane and specifying their index within areas (use Area and AreaIndex properties).
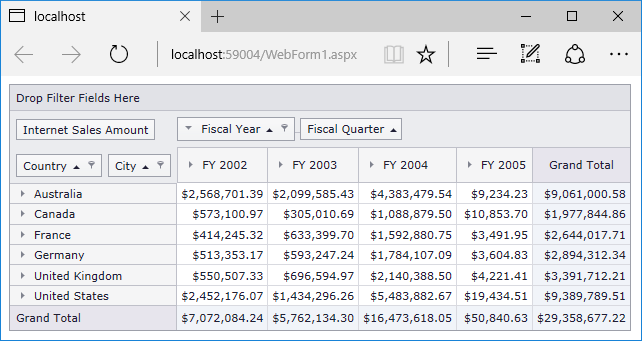
Put the Country and City fields (in this order) into the Row Header Area, and the Date.Fiscal group into the Column Header Area. Click OK.
Result
Run the project to see the result.