Applying a Predefined Chart Layout and Style
- 2 minutes to read
After creating a chart, you can change its appearance by applying one of the predefined ASPxSpreadsheet layouts and styles. For this, click the chart you wish to format, to display the Chart Tools contextual tab.
Apply a Predefined Chart Layout
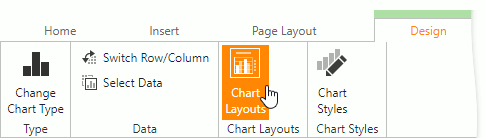
Click the Chart Layouts button in the Chart Layouts group within the Design tab.
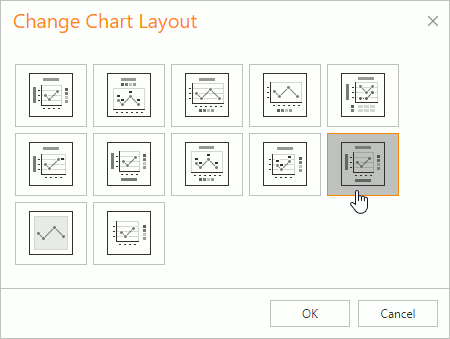
In the invoked Change Chart Layout dialog, select the required chart layout. For example, select Layout 10, which positions the chart legend to the right of the chart area, and adds the chart and axis titles.
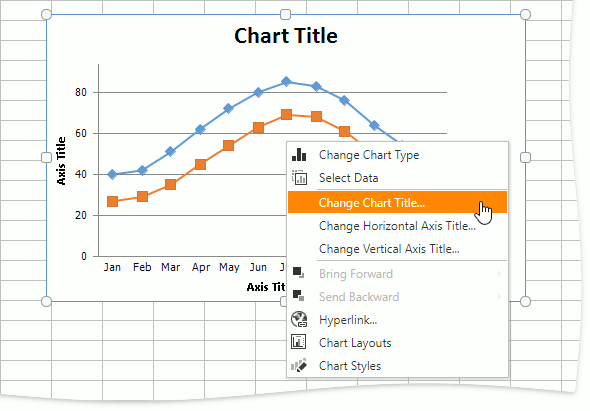
To enter the chart title, right-click the chart and select the Change Chart Title… item in the context menu.
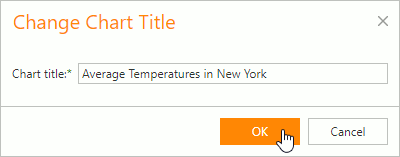
In the invoked Change Chart Title dialog box, enter a title and click OK.
To provide horizontal or vertical axis titles, right-click the chart and select the Change Horizontal Axis Title… or Change Vertical Axis Title… item in the context menu. Type a new title in the invoked dialog box.
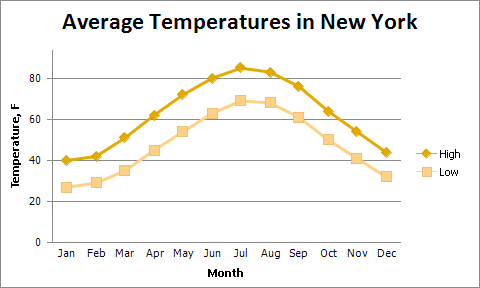
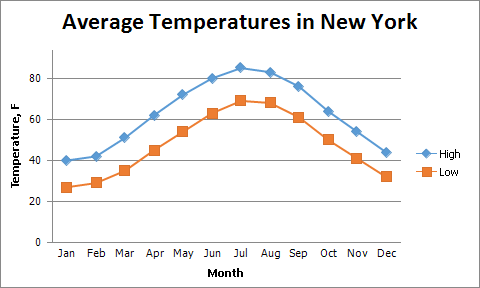
The image below shows the result.
Apply a Predefined Style
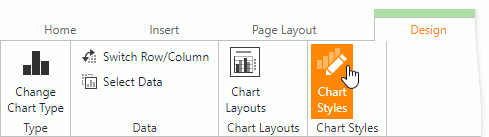
Click the Chart Styles button in the Chart Styles group of the Design tab.
In the invoked Change Chart Style dialog, select a new chart style and click OK.
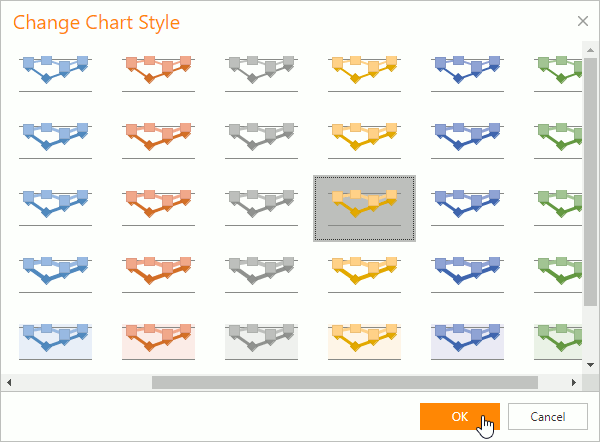
The image below shows a chart with Style 22 applied.