Client Chart Designer
This document describes how the Chart Designer can be invoked and localized.
This document consists of the following sections.
The Client Chart Designer Overview
The Chart Designer is organized into three main areas, which are represented below.

The Chart Structure Tree allows you to quickly select chart elements, change the structure of a chart (add or delete elements) and also represent chart structure. When you click an element, its settings will be displayed in the Chart Element Properties area.
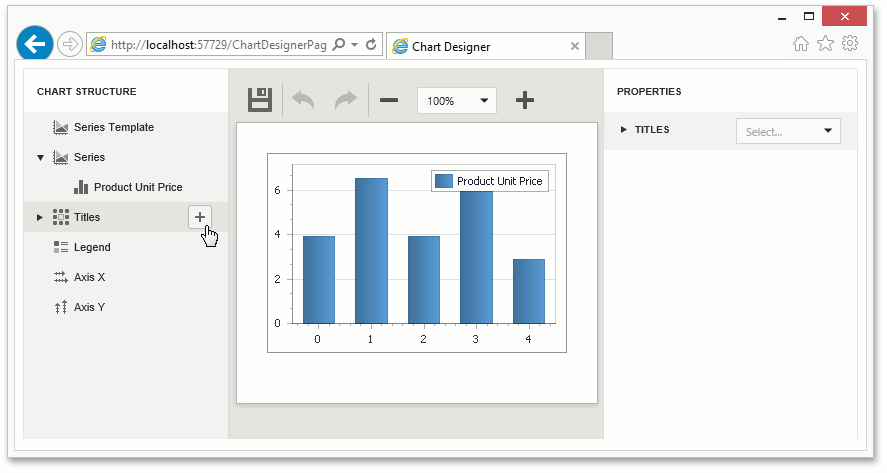
- The Chart Layout area allows you to see how the chart looks.
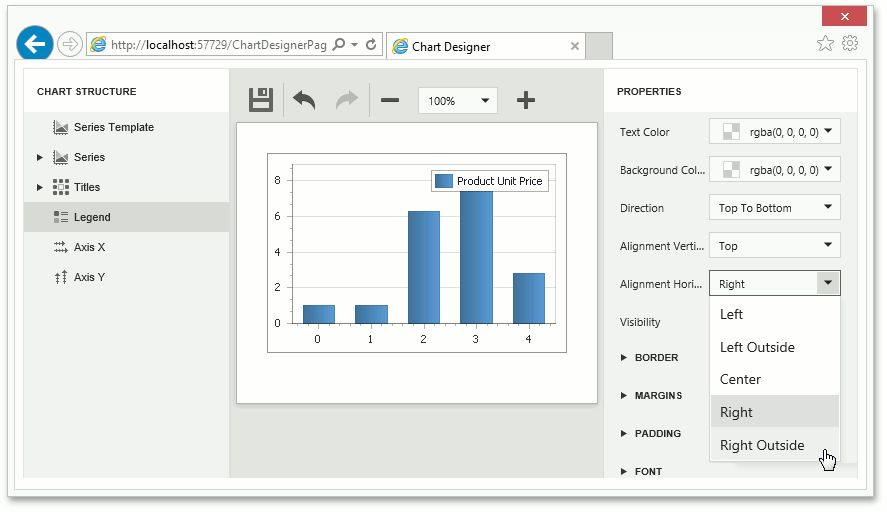
The Chart Element Properties area allows you to customize a chart element’s commonly used properties.
Invoke the Client Chart Designer
The Client Chart Designer is represented by an instance of the ASPxChartDesigner class. To specify the chart control for which the Chart Designer is invoked, call the Designer’s ASPxChartDesigner.OpenChart method with a WebChartControl object as parameter.

For a runtime example, refer to How to: Invoke the Client Chart Designer.