Scatter Polar Line Chart
- 2 minutes to read
Short Description
The Scatter Polar Line Chart is represented by the ScatterPolarLineSeriesView object, which belongs to both Polar Series Views and Point, Line and Spline Series Views. This view shows trends for several series and compares their values for the same point arguments on a circular diagram on the basis of angles. The series point is also represented in the same order that they have in the collection. That is in contrast to other view types that sort their points by arguments, and some aggregate points with equal arguments into a single entry along the X-axis.
For example, the following image demonstrates a Scatter Polar Line Chart, representing a graph for the Archimedean spiral.
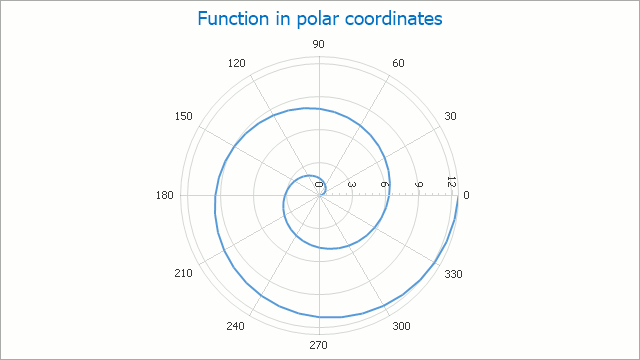
Chart Type Characteristics
The table below lists the main characteristics of this chart type.
| Feature | Value |
|---|---|
| Series View type | ScatterPolarLineSeriesView |
| Diagram type | 2D-PolarDiagram |
| Number of arguments per series point | 1 |
| Number of values per series point | 1 |
Note
For information on which chart types can be combined with the Scatter Polar Line Chart, refer to the Combining Different Series Views document.
Example
The following example demonstrates how to create a Scatter Polar Line Chart.
Note that this series view type is associated with the PolarDiagram type, and you should cast your Diagram object to this type in order to access its specific options.
<%@ Page Title="Home Page" Language="C#" MasterPageFile="~/Site.Master" AutoEventWireup="true" CodeBehind="Default.aspx.cs" Inherits="ScatterPolarLine._Default" %>

<%@ Register Assembly="DevExpress.XtraCharts.v15.1.Web, Version=15.1.1.0, Culture=neutral, PublicKeyToken=b88d1754d700e49a" Namespace="DevExpress.XtraCharts.Web" TagPrefix="dxchartsui" %>
<%@ Register Assembly="DevExpress.XtraCharts.v15.1, Version=15.1.1.0, Culture=neutral, PublicKeyToken=b88d1754d700e49a" Namespace="DevExpress.XtraCharts" TagPrefix="cc1" %>

<asp:Content runat="server" ID="BodyContent" ContentPlaceHolderID="MainContent">
    <dxchartsui:WebChartControl ID="WebChartControl1" runat="server" Height="351px" Width="552px">
        <diagramserializable>
            <cc1:PolarDiagram RotationDirection="Clockwise" StartAngleInDegrees="5">
            </cc1:PolarDiagram>
        </diagramserializable>
        <legend visibility="False"></legend>
        <seriesserializable>
            <cc1:Series Name="Series 1">
                <points>
                    <cc1:SeriesPoint ArgumentSerializable="0" Values="0.523598">
                    </cc1:SeriesPoint>
                    <cc1:SeriesPoint ArgumentSerializable="30" Values="0.583598">
                    </cc1:SeriesPoint>
                    <cc1:SeriesPoint ArgumentSerializable="60" Values="1.047197">
                    </cc1:SeriesPoint>
                    <cc1:SeriesPoint ArgumentSerializable="90" Values="1.570796">
                    </cc1:SeriesPoint>
                    <cc1:SeriesPoint ArgumentSerializable="120" Values="2.094395">
                    </cc1:SeriesPoint>
                    <cc1:SeriesPoint ArgumentSerializable="150" Values="2.617993">
                    </cc1:SeriesPoint>
                    <cc1:SeriesPoint ArgumentSerializable="180" Values="3.141592">
                    </cc1:SeriesPoint>
                    <cc1:SeriesPoint ArgumentSerializable="210" Values="3.665191">
                    </cc1:SeriesPoint>
                    <cc1:SeriesPoint ArgumentSerializable="240" Values="4.188790">
                    </cc1:SeriesPoint>
                    <cc1:SeriesPoint ArgumentSerializable="270" Values="4.712388">
                    </cc1:SeriesPoint>
                    <cc1:SeriesPoint ArgumentSerializable="300" Values="5.235987">
                    </cc1:SeriesPoint>
                    <cc1:SeriesPoint ArgumentSerializable="330" Values="5.759586">
                    </cc1:SeriesPoint>
                    <cc1:SeriesPoint ArgumentSerializable="0" Values="6.283185">
                    </cc1:SeriesPoint>
                    <cc1:SeriesPoint ArgumentSerializable="30" Values="6.806784">
                    </cc1:SeriesPoint>
                    <cc1:SeriesPoint ArgumentSerializable="60" Values="7.330382">
                    </cc1:SeriesPoint>
                    <cc1:SeriesPoint ArgumentSerializable="90" Values="7.853981">
                    </cc1:SeriesPoint>
                     <cc1:SeriesPoint ArgumentSerializable="120" Values="8.377580">
                    </cc1:SeriesPoint>
                    <cc1:SeriesPoint ArgumentSerializable="150" Values="8.901179">
                    </cc1:SeriesPoint>
                    <cc1:SeriesPoint ArgumentSerializable="180" Values="9.424777">
                    </cc1:SeriesPoint>
                    <cc1:SeriesPoint ArgumentSerializable="210" Values="9.948376">
                    </cc1:SeriesPoint>
                    <cc1:SeriesPoint ArgumentSerializable="240" Values="10.4719755">
                    </cc1:SeriesPoint>
                    <cc1:SeriesPoint ArgumentSerializable="270" Values="10.9955742">
                    </cc1:SeriesPoint>
                    <cc1:SeriesPoint ArgumentSerializable="300" Values="11.5191730">
                    </cc1:SeriesPoint>
                     <cc1:SeriesPoint ArgumentSerializable="330" Values="12.04277183">
                    </cc1:SeriesPoint>
                    <cc1:SeriesPoint ArgumentSerializable="0" Values="12.56637061">
                    </cc1:SeriesPoint>
                </points>
                <viewserializable>
                    <cc1:ScatterPolarLineSeriesView>
                        <linestyle dashstyle="DashDot" />
                    </cc1:ScatterPolarLineSeriesView>
                </viewserializable>
            </cc1:Series>
        </seriesserializable>
        <seriestemplate>
            <viewserializable>
                <cc1:ScatterPolarLineSeriesView>
                </cc1:ScatterPolarLineSeriesView>
            </viewserializable>
        </seriestemplate>
        <titles>
            <cc1:ChartTitle Text="Scatter Polar Line Chart" />
        </titles>
    </dxchartsui:WebChartControl>
</asp:Content>